
Insurance Coverage & Costs
Costs
The Uninsured
Private Coverage
Employer Sponsored
Individual
Public Coverage
Medicare
Medicaid and SCHIP
Access to Care
Quality & Care Delivery
Health Care Markets
Issue Briefs
Data Bulletins
Research Briefs
Policy Analyses
Community Reports
Journal Articles
Other Publications
Surveys
Site Visits
Design and Methods
Data Files
|

Tracking Health Care Costs:
Hospital Care Key Cost Driver in 2000
Data Bulletin No. 21 - Revised
September 2001
Bradley C. Strunk, Paul B. Ginsburg, Jon R. Gabel
 ospital spending accounted for the largest portion—43 percent—of
medical cost increases in 2000 (see Figure 1). Overall,
health care spending growth per privately insured person increased 7.2 percent
in 2000—the largest year-to-year increase since 1990
(see Table
1).
Rapid rises in underlying medical costs, double-digit premium increases and the
slowing economy could create a volatile combination that may increase consumers’
out-of-pocket costs and the ranks of the uninsured. ospital spending accounted for the largest portion—43 percent—of
medical cost increases in 2000 (see Figure 1). Overall,
health care spending growth per privately insured person increased 7.2 percent
in 2000—the largest year-to-year increase since 1990
(see Table
1).
Rapid rises in underlying medical costs, double-digit premium increases and the
slowing economy could create a volatile combination that may increase consumers’
out-of-pocket costs and the ranks of the uninsured.
FIGURE 1
SOURCES OF COST INCREASE, 1999 AND 2000 |
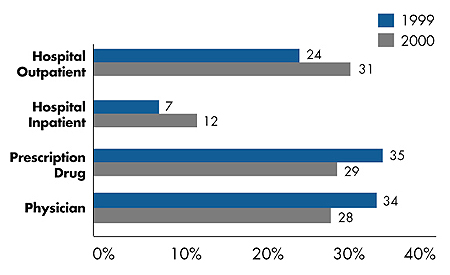 |
Note: 1999 sources of cost increase reflect August 2001
revision in spending data by Milliman USA.
Source: Milliman USA Health Cost Index ($0 deductible) |
Back to Top
Underlying Cost Trends
 n 2000, health care spending reflected significant shifts in growth of
underlying cost components, particularly for hospital services (see Figure 1). n 2000, health care spending reflected significant shifts in growth of
underlying cost components, particularly for hospital services (see Figure 1).
- Spending for outpatient care increased 11.2 percent in 2000,
accounting for 31 percent of the overall increase. The 2000
outpatient spending increase was the largest since 1992.
- Spending for inpatient care increased 2.8 percent in 2000,
accounting for 12 percent of the overall increase. The inpatient
increase signals a dramatic departure from the 1994-98 trend,
when inpatient spending actually declined year-to-year by as
much as 5.3 percent.
Consumer demand for broad networks of hospitals and physicians and the retreat
from tightly managed care—coupled with hospital consolidation and reduction in
excess capacity—have increased some hospitals’ bargaining leverage with health
plans. Growing numbers of contract showdowns between providers and health plans
are occurring as providers use their clout to gain higher payments.
Health care payroll growth also is a key driver of overall costs. Payroll costs
for all health services increased 4.7 percent in 2000, compared to 3.1 percent
in 1999, while hospital payroll costs increased 3.7 percent in 2000, compared
to 2.6 percent in 1999. The higher payroll growth in 2000 is largely accounted
for by increased growth in hours worked rather than faster-growing average hourly
wages. But during the first five months of 2001, average hourly wage growth increased
sharply, particularly for hospitals, perhaps because of nursing and other staff
shortages.
Other underlying cost trends include:
- Spending growth for prescription drugs—while still very high—slowed, dropping
to 14.5 percent and accounting for 29 percent of the overall increase in 2000.
Two factors likely caused the reduction: a lack of new "blockbuster" drugs
and the shift to three-tier pharmacy benefits.
- Spending growth for physician services slowed in 2000 to 4.8 percent, accounting
for 28 percent of the overall increase.
Back to Top
Implications for Consumers
n 2001, employer-based insurance
premiums increased 11 percent-the
fifth straight year of rising premiums
and the highest increase since 1993.
The large difference between the 2001 premium increase and the underlying cost
increase in 2000-11 percent vs. 7.2 percent-reflects both expectations of higher
costs and the health insurance underwriting cycle, or the pattern of premium trends
diverging from expected costs. The expectation of higher costs is reflected in
the 9.5 percent premium increase for self-insured plans in 2001. The underwriting
cycle is reflected by the much higher premium increase of 12.3 percent for fully
insured plans in 2001, signaling insurers’ willingness to sacrifice market share
to restore profit margins.
Insured consumers generally have been sheltered from cost increases in recent
years because employers have paid a disproportionate share of higher premiums
in past years. In 2001, the employee share of premiums remained stable at 15 percent
for single coverage and 27 percent for family coverage. But, with a slowing economy,
this could change. Indeed, employers have increased patient cost sharing already
for pharmaceuticals and are expected to do the same for hospital and physician
services. In contrast to the last time cost trends were this high-in the early
1990s-the cost-containment strategies of managed care are now in retreat, leaving
few ways to stem the rising cost tide.
Back to Top
This Data Bulletin is based on data from the Milliman USA Health Cost Index
($0 deductible), which is designed to reflect claims increases faced by private
insurers; the Kaiser Family Foundation/Health Research and Educational Trust
survey of employer-based health plans for 1999-2001; the KPMG survey of employer-based
plans for 1991-98; the U.S. Bureau of Labor Statistics Employment, Hours and
Earnings series to track payroll costs; and Center for Studying Health System
Change 2000-01 site visits (see www.hschange.org). The bulletin is adapted from
“Tracking Health Care Costs,” by Bradley C. Strunk, Paul B. Ginsburg and Jon
R. Gabel, Health Affairs, Web-exclusive publication, Sept. 26, 2001,
www.healthaffairs.org.
Data Bulletins are published by the Center for Studying Health System Change
(HSC)
President: Paul B. Ginsburg
Director of Public Affairs: Ann C. Greiner
Editor: The Stein Group
|