
Patient Cost Sharing: How Much is Too Much?
Issue Brief No. 72
December 2003
Sally Trude
![]() esponding to successive years of double-digit health insurance premium increases,
employers continue to restructure health benefits to slow the rise in company costs
by increasing patients’ financial stake in their care. A new Center for Studying
Health System Change (HSC) study examines how increased patient cost sharing
through higher deductibles, copayments and coinsurance raises patients’ out-of-pocket
costs. Increased patient cost sharing creates more financial burdens for seriously ill
and low-income workers. Concerns about financial hardships for seriously ill and
low-income workers may limit employers’ ability to slow rising premiums through
increased patient cost sharing.
esponding to successive years of double-digit health insurance premium increases,
employers continue to restructure health benefits to slow the rise in company costs
by increasing patients’ financial stake in their care. A new Center for Studying
Health System Change (HSC) study examines how increased patient cost sharing
through higher deductibles, copayments and coinsurance raises patients’ out-of-pocket
costs. Increased patient cost sharing creates more financial burdens for seriously ill
and low-income workers. Concerns about financial hardships for seriously ill and
low-income workers may limit employers’ ability to slow rising premiums through
increased patient cost sharing.
- Retreat from Tightly Managed Care Leads to Greater Patient Financial Stake
- Changing Benefit Structures
- Who Pays More?
- Cost Sharing and Income
- Implications
- Notes
- Data Source
- Supplemental Table
Retreat from Tightly Managed Care Leads to Greater Patient Financial Stake
![]() he hallmark of tightly managed
care was a generous benefit
structure—typically no deductibles,
low copayments and expanded coverage
for preventive services—coupled
with administrative controls on care
use and restricted choice of providers.
The patient and physician rebellion
against tightly managed care led to
expanded provider networks and
fewer restrictions on care. Due in part
to these changes, health spending and
insurance costs began rising rapidly
again in the late 1990s.
he hallmark of tightly managed
care was a generous benefit
structure—typically no deductibles,
low copayments and expanded coverage
for preventive services—coupled
with administrative controls on care
use and restricted choice of providers.
The patient and physician rebellion
against tightly managed care led to
expanded provider networks and
fewer restrictions on care. Due in part
to these changes, health spending and
insurance costs began rising rapidly
again in the late 1990s.
Confronted again with rapidly rising health insurance premiums, employers started shifting more health costs to workers. Employers can shift costs two main ways: Increasing workers’ premium contribution share—the percentage they pay of the total premium—or increasing patient cost sharing through higher deductibles, copayments and coinsurance when patients receive care. Employers primarily have opted for the latter.
Health benefit managers interviewed during HSC’s site visits to 12 nationally representative communities1 noted that managed care’s generous first-dollar coverage encouraged patients to use too many services because they lacked a financial stake in their health care decisions. Expecting that a significant increase in out-of-pocket costs would moderate use of health care services, employers have raised deductibles and copayments; added copayments to more services; replaced fixed-dollar copayments with coinsurance, where patients pay a percentage of the total bill; and adopted tiered prescription drug benefits.2 Nationally, employers are estimated to have increased patient cost sharing to buy down—or reduce—average premiums by 2 percent to 3 percent in 2002 and an additional 3 percent in 2003.3 Meanwhile, health plans are rapidly developing new products incorporating high deductibles and coinsurance.
Back to Top
Changing Benefit Structures
![]() o assess the potential financial impact of
increased patient cost sharing, HSC used
actuarial models to estimate patients’
expected average annual out-of-pocket
costs under a range of benefit structures
for single coverage (see Data Source).
Benefit Option 1 serves as the baseline,
with patient cost sharing of $10 for primary
care and specialist visits and no
deductible (see Table 1). Option 2, which
doubles physician visit copayments
and includes a $150 copayment for
emergency department visits and a $250
per day inpatient hospital copayment,
represents typical copayment increases. Next,
out-of-pocket costs for benefit structures with
successively higher levels of deductibles and
coinsurance (Options 3, 4, 5 and 6) are estimated
for up to a $2,500 deductible with 30
percent coinsurance for in-network care and 50
percent coinsurance for out-of-network care.
o assess the potential financial impact of
increased patient cost sharing, HSC used
actuarial models to estimate patients’
expected average annual out-of-pocket
costs under a range of benefit structures
for single coverage (see Data Source).
Benefit Option 1 serves as the baseline,
with patient cost sharing of $10 for primary
care and specialist visits and no
deductible (see Table 1). Option 2, which
doubles physician visit copayments
and includes a $150 copayment for
emergency department visits and a $250
per day inpatient hospital copayment,
represents typical copayment increases. Next,
out-of-pocket costs for benefit structures with
successively higher levels of deductibles and
coinsurance (Options 3, 4, 5 and 6) are estimated
for up to a $2,500 deductible with 30
percent coinsurance for in-network care and 50
percent coinsurance for out-of-network care.
Patients’ total out-of-pocket costs typically are capped by maximum out-ofpocket limits. In 2002, 41 percent of people in preferred provider organizations (PPOs) had a maximum out-of-pocket cap of $1,500 or less, while 5 percent had caps of $3,000 or more.4 For employers to capture savings from increased patient cost sharing, they either have to exclude deductibles or raise maximum out-of-pocket limits. Each scenario assumes that the maximum out-of-pocket limit is $1,500 higher than the deductible.
Under the baseline scenario, or Option 1, average out-of-pocket expenses are about $52 a year, and only 1 percent of people face out-of-pocket costs exceeding $500 a year (see Table 1). A moderate rise in patient cost sharing through higher copayments, as modeled in Option 2, increases average outof- pocket costs to $236. About 14 percent of people would pay more than $500 a year in out-of-pocket costs and 6 percent would exceed $1,000.
By going from Option 1 to Option 2, the employer buys down the premium increase by 9.5 percent through higher patient cost sharing. In this example, although average patient out-of-pocket costs are increased by $184 per year, the worker’s annual premium payment is reduced by $68, assuming the worker pays 20 percent of the premium. The employer’s premium contribution would drop by $271 per employee.
But the impact on the average worker masks the differences between those who use services and those who do not. Employers’ strategy of increasing patient cost sharing in lieu of increasing workers’ share of the premium shifts burdens from those who use few services to those who use many.
Back to Top
Table 1
Average Annual Out-of-Pocket Costs, Premiums and Buy Down, by Benefit
Scenario
| Baseline (Option 1) |
Higher Copayments (Option 2) |
$100/10% (Option 3) |
$500/20% (Option 4) |
$1,000/20% (Option 5) |
$2,500/40% (Option 6) |
|
| Average Annual Out-of-Pocket Costs |
$52
|
$236
|
$321
|
$612
|
$763
|
$1,051
|
| Percent of People Exceeding $500 |
1%
|
14%
|
19%
|
50%
|
49%
|
47%
|
| Percent of People Exceeding $1,000 |
0%
|
6%
|
9%
|
21%
|
36%
|
34%
|
| Percent of People Exceeding $1,500 |
0%
|
0%
|
6%
|
14%
|
18%
|
26%
|
| Total Premium |
$3,584
|
$3,245
|
$3,058
|
$2,495
|
$2,202
|
$1,650
|
| Percent Buy Down from Baseline |
0%
|
-9.5%
|
-14.7%
|
-30.4%
|
-38.6%
|
-54.0%
|
| Notes: Baseline (Option 1) has $10 physician visit
copayments and no deductibles. Option 2 doubles the copayments for physician
visits and introduces a $150 copayment for emergency department visits and
a $250 per day inpatient hospital copayment. Option 3 has a $100 deductible
and 10 percent in-network and 20 percent out-of-network coinsurance. Option
4 has a $500 deductible and 20 percent in-network and 30 percent out-of-network
coinsurance. Option 5 has a $1,000 deductible and 20 percent in-network
and 30 percent out-of-network coinsurance. Option 6 has a $2,500 deductible
and 30 percent in-network and 50 percent out-of-network coinsurance. Maximum
out-of-pocket limits are set at $1,500 more than the deductible for each
scenario. Source: Actuarial Research Corp. models using 1997 MEPS calibrated to 2003 utilization and costs |
||||||
Who Pays More?
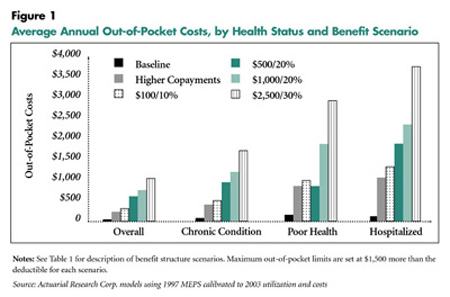
![]() ncreased patient cost sharing raises out-ofpocket
costs more for people with chronic
conditions, those in poor health and people
with at least one hospitalization (see Figure
1). For example, under the Option 2 benefit
structure, people in poor health would pay
$862 a year on average, while those with at
least one hospitalization would pay $1,066.
Under the higher-deductible scenarios
(Options 5 and 6), people in poor health
would pay $1,883 on average with a $1,000
deductible and $2,942 with a $2,500
deductible. A hospitalized patient would
pay $2,355 a year on average with a $1,000
deductible and $3,768 with a $2,500
deductible.
ncreased patient cost sharing raises out-ofpocket
costs more for people with chronic
conditions, those in poor health and people
with at least one hospitalization (see Figure
1). For example, under the Option 2 benefit
structure, people in poor health would pay
$862 a year on average, while those with at
least one hospitalization would pay $1,066.
Under the higher-deductible scenarios
(Options 5 and 6), people in poor health
would pay $1,883 on average with a $1,000
deductible and $2,942 with a $2,500
deductible. A hospitalized patient would
pay $2,355 a year on average with a $1,000
deductible and $3,768 with a $2,500
deductible.
Additionally,more people risk having to spend more than $1,500 out of pocket with high-deductible health plans (see Webexclusive data). Overall, about 18 percent of people with a $1,000 deductible under Option 5 would pay more than $1,500 out of pocket annually, compared with 26 percent of people with a $2,500 deductible under Option 6. However, more than 90 percent of people who are hospitalized in the $2,500 deductible scenario will pay more than $1,500 out of pocket.
Back to Top
|
Cost Sharing and Income
Although the seriously ill face higher out-of-pocket costs under high-deductible plans, a maximum out-of-pocket cap limits financial risk significantly.Without a maximum out-of-pocket limit, people in poor health would have average annual out-ofpocket costs of $3,979 with a $1,000 deductible (Option 5), and those with at least one hospitalization in a year would pay $5,782.
Recognizing that low-income workers are least able to afford rising premiums, a handful of employers interviewed during HSC site visits reported setting different premium contribution levels for workers based on their income. This approach, however, is less practical for patient cost sharing because of the administrative complexity created for health care providers, who must collect these amounts directly from patients. For people with incomes between 125 percent and 200 percent of the 2003 federal poverty level—between $11,225 and $17,960 for a single person—1 percent would have out-of-pocket costs exceeding 10 percent of income under the generous Option 1 benefit structure compared with 23 percent under the $2,500 deductible Option 6 (see Table 2).
Back to Top
Table 2
People with Out-of-Pocket Costs Exceeding 10 Percent of Income, by Health Status,
Income and Benefit Scenario
| Baseline (Option 1) |
Higher Copayments (Option 2) |
$100/10% (Option 3) |
$500/20% (Option 4) |
$1,000/20% (Option 5) |
$2,500/40% (Option 6) |
|
| Overall Population |
1%
|
2%
|
3%
|
5%
|
7%
|
13%
|
| Health Status | ||||||
| No Chronic Condition |
1
|
1
|
2
|
3
|
4
|
7
|
| Chronic Condition |
1
|
3
|
5
|
8
|
11
|
22
|
| Fair to Excellent Health |
1
|
2
|
3
|
5
|
6
|
12
|
| Poor Health |
5
|
12
|
14
|
25
|
32
|
53
|
| No Hospitalization |
1
|
2
|
3
|
5
|
6
|
12
|
| Hospitalized |
2
|
7
|
16
|
24
|
32
|
66
|
| Income Level | ||||||
| <100% Poverty |
8
|
25
|
32
|
44
|
47
|
47
|
| 100% to <125% |
2
|
6
|
11
|
23
|
33
|
34
|
| 125% to <200% |
1
|
3
|
5
|
11
|
16
|
23
|
| 200% to <400% |
1
|
1
|
2
|
3
|
6
|
23
|
| 400% and Above |
1
|
1
|
1
|
1
|
2
|
6
|
| Notes: See Table 1 for description of benefit structure
scenarios. Maximum out-of-pocket limits are set at $1,500 more than the
deductible for each scenario. Source: Actuarial Research Corp. models using 1997 MEPS calibrated to 2003 utilization and costs |
||||||
Implications
![]() mployers continue to increase patient
cost sharing to reduce annual premium
increases and to encourage workers to
economize when using health care services.
As out-of-pocket costs increase, however,
both the financial and medical consequences
for seriously ill and low-income people
increase. Nearly half of all personal bankruptcies
are due in part to medical expenses.5
And research suggests that patients faced
with higher cost sharing cut back on both
needed and discretionary care.6
mployers continue to increase patient
cost sharing to reduce annual premium
increases and to encourage workers to
economize when using health care services.
As out-of-pocket costs increase, however,
both the financial and medical consequences
for seriously ill and low-income people
increase. Nearly half of all personal bankruptcies
are due in part to medical expenses.5
And research suggests that patients faced
with higher cost sharing cut back on both
needed and discretionary care.6
Future market responses will likely focus on additional ways to encourage patients to economize on discretionary care. One potential response could refine patient cost sharing by differentiating the amounts by service category, with higher cost sharing for more discretionary or less clinically valuable services. Another response could waive cost sharing based on patient diagnosis. For example, to encourage a person with diabetes to seek regular eye and foot exams, cost sharing for these clinically valuable services could be waived for diabetics.
In addition, the market may provide options for less cost sharing but greater restrictions on the choice of provider—either a traditional closed network and tight administrative controls on care use or a tiered-provider network, where patients choose whether they want to pay more for a broader choice of providers. HSC’s Community Tracking Study Household Survey shows that most Americans, especially lower-income people, are willing to limit their choice of hospitals and physicians in return for lower out-of-pocket costs.7 As patient cost sharing increases, more people—especially low income workers and those with serious health conditions—might embrace an opportunity to make this cost-choice trade-off.
Regardless of the potential market responses, practitioner involvement will be critical in helping patients make cost-effective treatment decisions. Physicians will need to be more aware of patients’ financial resources and cost-sharing requirements, taking both into account as treatment options are discussed. And patients will need to be more comfortable in alerting physicians to financial issues.
Back to Top
Notes
Back to Top
Data Source
The actuarial models, developed by James W.Mays and Monica Brenner of Actuarial Research Corp., estimate out-of-pocket costs based on data from the 1997 Medical Expenditure Panel Survey (MEPS) calibrated to reflect typical 2003 employer spending for health care. Standard actuarial assumptions were made under each health benefit scenario to reflect that utilization of health services would fall as cost sharing increased. The model used -.15 as the elasticity for physician, outpatient hospital and emergency department visits, -.01 as the elasticity for inpatient hospital admissions and -.25 for prescription drug spending. Calculation of premium amounts assumed an additional 10 percent for administration and profit. The definition of chronic condition, based on physician review of ICD-9 codes, includes 111 chronic conditions for children and 177 chronic conditions for adults. Medical conditions in the MEPS data are self reported. See Hwang,Wenke, et al., "Out-of-Pocket Medical Care Spending for Care of Chronic Conditions," Health Affairs (November/December 2001).
Back to Top
Supplemental Table
Supplemental Table 1: People with Out-of-Pocket Costs Exceeding $1,500, by Benefit Scenario and Health Condition
ISSUE BRIEFS are published by the Center for Studying Health System Change.
President: Paul B. Ginsburg
Vice President: Len M. Nichols
Editor: The Stein Group
For additional copies or to be added to the mailing list, contact HSC at:
600 Maryland Avenue, SW
Suite 550
Washington, DC 20024-2512
Tel: (202) 484-5261 (for general HSC information)
Fax: (202) 484-9258
www.hschange.org