
| November 1999 Issue Brief No. 23 |
||
| June 1997 Issue Brief No. 10 |
||
| January 1997 Issue Brief No. 06 |
||
A Primer on Understanding Health Care Cost Trends: Issue Brief No. 05 |
||
Despite Fears, Costs Rise Only Modestly in 1998 Data Bulletin No. 13 |
||
Tracking Health Care Costs:
An Upswing in Premiums and Costs Underlying Health Insurance
Data Bulletin No. 20
November 2000
![]() he great ride for employers, government and consumers,
during which health insurance premiums increased at unprecedented low rates,
is over. Premiums, which increased on average only 2 percent per year between
1994 and 1998, increased 8.3 percent in 2000 (see Figure
1). This sharp rise reflects both substantial increases in the costs underlying
insurance premiums and a steeper one in premiums associated with the health
insurance underwriting cycle (see Issue Brief No. 31).
he great ride for employers, government and consumers,
during which health insurance premiums increased at unprecedented low rates,
is over. Premiums, which increased on average only 2 percent per year between
1994 and 1998, increased 8.3 percent in 2000 (see Figure
1). This sharp rise reflects both substantial increases in the costs underlying
insurance premiums and a steeper one in premiums associated with the health
insurance underwriting cycle (see Issue Brief No. 31).
For 2000, the premium increase for fully insured plans was 9.6 percent, in contrast to the 7.1 percent rise for self-insured plans. This cyclical pattern is providing employers with another reason to self-insure and to deemphasize plan types that are most commonly fully insured, such as health maintenance organizations (HMOs). In fact, the proportion of employees in firms that self-insure rose from 48 percent to 51 percent between 1999 and 2000.
| FIGURE 1 ANNUAL INCREASE IN EMPLOYER-BASED INSURANCE PREMIUMS AND UNDERLYING SPENDING |
|||
|
|
PREMIUM INCREASES
|
|
|
|
YEAR
|
LARGE FIRMS a
|
ALL FIRMS
|
UNDERLYING HEALTH CARE SPENDING
|
|
1991
|
11.5%
|
b
|
6.9%
|
|
1992
|
10.9
|
b
|
6.6
|
|
1993
|
8.0
|
8.5%
|
5.0
|
|
1994
|
4.8
|
b
|
2.1
|
|
1995
|
2.1
|
2.3
|
2.2
|
|
1996
|
0.5
|
0.8
|
2.0
|
|
1997
|
2.1
|
b
|
3.3
|
|
1998
|
3.3
|
3.7
|
5.1
|
|
1999
|
4.1
|
4.8
|
6.6
|
|
2000
|
7.5
|
8.3
|
6.5c
|
| a Firms with 200 or more workers. b Not available. c Data through March 2000, compared with corresponding months in 1999. Source: Spending data are from the Milliman & Robertson Health Cost Index ($0 deductible). Premium data are from the Kaiser/HRET survey of employer-based health plans for 1998-2000 and the KPMG survey for 1993-1998. |
|||
Underlying Cost Trends
The trend in costs underlying private health insurance premiums generally determines the trend in premium costs over time. These costs rose by 6.6 percent in 1999, up from an average increase of 2.4 percent per year from 1993 to 1997 (see Figure 2).
The 1999 increase followed a pattern similar to prior years, with sharply higher spending for drugs and hospital outpatient services, but small or negative changes in hospital inpatient spending (see Figure 3).
- Drug spending accounted for 44
percent of the 1999 cost increase.
About one-third was due to higher
drug prices, the rest to new drugs
and increases in use of existing drugs.
- Hospital outpatient spending, which
accounted for 21 percent of the
increase, has grown at a consistently
high rate throughout the 1990s,
with annual per capita cost increases
averaging around 8.5 percent.
- Hospital inpatient spending accounted
for only 3 percent of the increase,
continuing the pattern of the last
half-decade, during which per capita
spending fell more often than it rose.
- Growth in physician spending, which accounted for 32 percent of the cost increase, dipped in the mid-1990s- a period of substantial deflation in physician fees paid by private insurers- but by 1999 had nearly returned to the levels seen earlier in the decade.
| FIGURE 2 ANNUAL CHANGE PER CAPITA IN HEALTH CARE EXPENDITURES, BY COMPONENT, 1991-1999 |
|||||
| YEAR | ALL BENEFITS | HOSPITAL INPATIENT | HOSPITAL OUTPATIENT | PHYSICIAN | PRESCRIPTION DRUG |
| 1991 | 6.9% | 3.5% | 16.8% | 5.4% | 12.4% |
| 1992 | 6.6 | 2.8 | 13.9 | 5.9 | 11.7 |
| 1993 | 5.0 | 4.8 | 8.9 | 3.3 | 7.1 |
| 1994 | 2.1 | -2.0 | 8.7 | 1.7 | 5.2 |
| 1995 | 2.2 | -3.5 | 7.9 | 1.9 | 10.6 |
| 1996 | 2.0 | -4.4 | 7.7 | 1.6 | 11.0 |
| 1997 | 3.3 | -5.3 | 9.5 | 3.4 | 11.5 |
| 1998 | 5.1 | -0.9 | 7.8 | 4.7 | 14.1 |
| 1999 | 6.6 | 0.6 | 8.4 | 5.2 | 18.4 |
| 2000a | 6.5 | 1.0 | 8.2 | 5.2 | 17.2 |
| a Data through March 2000, compared
with corresponding months in 1999. Source: Milliman & Robertson Health Cost Index ($0 deductible) |
|||||
Figure 3
SOURCES OF THE 1999 COST INCREASE
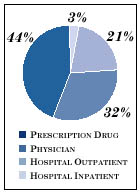
Source: Milliman & Robertson Health Cost Index ($0 deductible)
Implications for Consumers
These trends ultimately will affect consumers, who generally have been insulated from cost increases in recent years. Out-of-pocket spending for medical services and drugs declined throughout the 1990s, primarily because of a shift to managed care and its richer benefit structure. Now that most people are in managed care, out-of-pocket spending is likely to parallel premium trends.
During the late 1990s, employers absorbed a large portion of premium increases, especially for those employees with single coverage. But should the economy weaken, this trend could reverse. If that happens, sharp increases in employee contributions to health coverage could exacerbate the growing problem of employees with the lowest earnings not enrolling in plans for which they are eligible and becoming uninsured (see Issue Brief No. 22). Prescription drugs is one area where employees have not been insulated from rising costs, where very rapid spending increases on pharmaceuticals have led many employers to increase copayments for brand-name drugs that are not on their formularies.
Several factors indicate that spending increases will continue to be higher than in recent years. These include responses to the managed care backlash, expensive new technologies and provider consolidation. However, the large, double-digit increases of the late 1980s and early 1990s are not likely to return. Today’s health care markets are more competitive, and price pressure on providers is likely to lead to continuing efforts on their part to cut their costs.
This Data Bulletin is based on data from the Milliman & Robertson Health Cost Index, which is designed to reflect cost increases faced by private insurers; the Kaiser Family Foundation/Hospital Research and Education Trust survey of employer-based health plans for 1998-2000; and the KPMG survey of employer-based health plans for 1993-1998. It is adapted from “Tracking Health Care Costs: Inflation Is Back,” by Christopher Hogan, Paul B. Ginsburg and Jon Gabel, Health Affairs, Vol. 19, No. 6 (November/December 2000).