
More Children and Working-Age Americans Go Without Prescribed Drugs Because of Cost |
||
Access to Prescription Drugs for Medicare Beneficiaries Tracking Report No. 23 |
||
More Nonelderly Americans Face Problems Affording Prescription Drugs
Tracking Report No. 22
January 2009
Laurie E. Felland, James D. Reschovsky
More children and working-age Americans are going without prescription drugs
because of cost concerns, according to a new national study by the Center for
Studying Health System Change (HSC). In 2007, one in seven Americans under age
65 reported not filling a prescription in the previous year because they couldn’t
afford the medication, up from one in 10 in 2003. Rising prescription drug costs
and less generous drug coverage likely contributed to the growth in nonelderly
Americans—from 10.3 percent in 2003 to 13.9 percent in 2007—who went
without a prescribed medication. The most vulnerable people—those with
low incomes, chronic conditions and the uninsured—continue to face the
greatest unmet prescription drug needs. Uninsured, working-age Americans saw
the biggest jump in unmet prescription drug needs between 2003 and 2007, with
the proportion rising from 26 percent to almost 35 percent. At the same time,
a growing proportion of working-age Americans with employer-sponsored insurance
reported going without prescription medications. The number of Americans who
cannot afford prescription medications is likely to grow as the economy continues
to decline and the ranks of the uninsured grow.
- Drug Affordability Problems Grow
- Insurance Helps But Less
- Changes Vary by Coverage Type
- Income Levels and Chronic Conditions
- Implications
- Notes
- Data Source and Funding Acknowledgements
Drug Affordability Problems Grow
![]() fter remaining steady in the early part of the decade,
the proportion of Americans under age 65 reporting problems affording prescription
drugs increased from 10.3 percent in 2003 to 13.9 percent in 2007— a 35
percent increase, according to findings from HSC’s 2007 Health Tracking
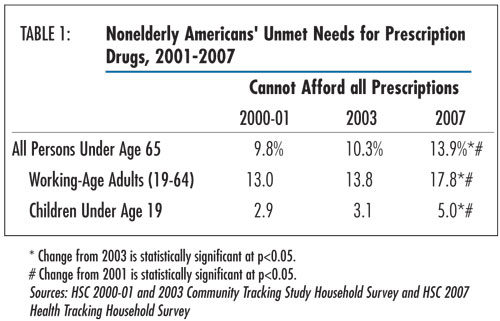
Household Survey (see Data Source and Table 1). Approximately
36.1 million working-age (19-64) adults and children went without prescription
drugs because of cost concerns in 2007, an increase of 11.7 million people from
2003.
fter remaining steady in the early part of the decade,
the proportion of Americans under age 65 reporting problems affording prescription
drugs increased from 10.3 percent in 2003 to 13.9 percent in 2007— a 35
percent increase, according to findings from HSC’s 2007 Health Tracking
Household Survey (see Data Source and Table 1). Approximately
36.1 million working-age (19-64) adults and children went without prescription
drugs because of cost concerns in 2007, an increase of 11.7 million people from
2003.
Unmet prescription drug needs among working-age adults increased from 13.8 percent to 17.8 percent between 2003 and 2007—a 29 percent increase. Because children typically are in better health and require fewer medications than adults, they have fewer prescription drug access problems. Nevertheless, unmet prescription drug needs between 2003 and 2007 grew even faster among children, from 3.1 percent to 5 percent—affecting 3.9 million children in 2007.
The increase in affordability problems likely stemmed from higher prescribing rates, drug prices that are rising faster than workers’ earnings, higher patient cost sharing in private insurance and the introduction of expensive new medications.
Although increases in drug spending growth, reflecting increases in both price and utilization, slowed in recent years—from almost 16 percent in 2003 to 5.5 percent in 2007—expensive biologics and other specialty drugs are becoming a larger share of drug spending.1 Patients with prescription drug coverage also are paying a larger share of prescription drug costs, especially for brand-name drugs. Most insurers have adopted tiered cost sharing for prescription drugs, where patients pay increasingly larger amounts for generic, preferred brand-name, nonpreferred brand-name and, in some cases, specialty or biologic drugs, and the differences in payment have been increasing over time.
Click here to view this figure as a PowerPoint slide.
Insurance Helps But Less
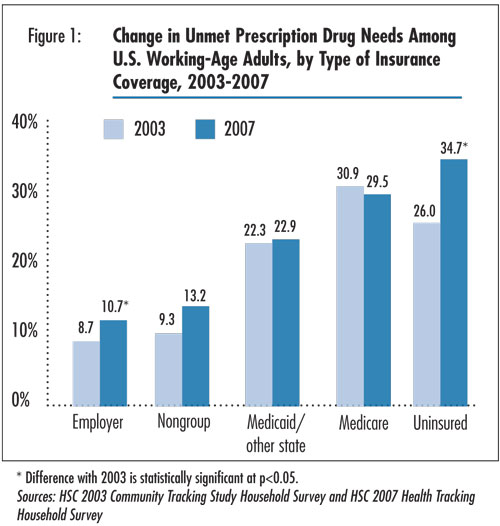
![]() nsurance coverage remains a key indicator of a person’s
ability to afford prescription drugs (see Figure 1). Access
remains best for working-age adults with employer-sponsored insurance, with
10.7 percent reporting unmet prescription needs, followed by those with nongroup,
or individual, insurance.2 More than 95 percent of working-age
adults with employer-sponsored insurance have prescription drug coverage. Among
insured, working-age adults without prescription drug coverage, 18 percent reported
going without a needed prescription drug in 2007, compared with 10.5 percent
with drug coverage.
nsurance coverage remains a key indicator of a person’s
ability to afford prescription drugs (see Figure 1). Access
remains best for working-age adults with employer-sponsored insurance, with
10.7 percent reporting unmet prescription needs, followed by those with nongroup,
or individual, insurance.2 More than 95 percent of working-age
adults with employer-sponsored insurance have prescription drug coverage. Among
insured, working-age adults without prescription drug coverage, 18 percent reported
going without a needed prescription drug in 2007, compared with 10.5 percent
with drug coverage.
The uninsured have the greatest problems affording prescription drugs, with 34.7 percent reporting they couldn’t afford a prescription drug in 2007. Working-age adults with public insurance fall in between. Nearly one in four working-age adults with Medicaid or other state insurance reported difficulties affording prescription drugs,3 while nearly three in 10 working-age Medicare beneficiaries reported such problems. Despite the implementation of the Medicare prescription drug benefit in January 2006, unmet needs among working-age Medicare beneficiaries are nearly as great as among the uninsured. Most working-age adults eligible for Medicare are disabled and often have very high prescription drug needs and low incomes.
Back to Top
Click here to view this figure as a PowerPoint slide.
Changes Vary by Coverage Type
![]() hanges in unmet prescription drug needs for working-age Americans between 2003 and 2007 also varied markedly by type of insurance coverage. Access problems among working-age adults with employer coverage grew from 8.7 percent to 10.7 percent. Uninsured people fared the worst over the past several years, with the proportion reporting unmet prescription drug needs rising from 26 percent to 34.7 percent, or a total of nearly 12.5 million working-age Americans in 2007. There were no statistically significant changes between 2003 and 2007 in unmet prescription drug needs among working-age adults with Medicaid or Medicare coverage. In past years, working-age adults with Medicaid and uninsured, working-age adults had similar rates of unmet needs for prescription drugs, but the gap has widened as drug access worsened for uninsured people.
hanges in unmet prescription drug needs for working-age Americans between 2003 and 2007 also varied markedly by type of insurance coverage. Access problems among working-age adults with employer coverage grew from 8.7 percent to 10.7 percent. Uninsured people fared the worst over the past several years, with the proportion reporting unmet prescription drug needs rising from 26 percent to 34.7 percent, or a total of nearly 12.5 million working-age Americans in 2007. There were no statistically significant changes between 2003 and 2007 in unmet prescription drug needs among working-age adults with Medicaid or Medicare coverage. In past years, working-age adults with Medicaid and uninsured, working-age adults had similar rates of unmet needs for prescription drugs, but the gap has widened as drug access worsened for uninsured people.
An important factor contributing to the large increase in unmet prescription drug needs overall is a shift in the population from insurance groups that have lower rates of unmet needs to those with higher rates. The share of working-age adults with employer coverage fell from 64.5 percent in 2003 to 61.1 percent in 2007, while the share that was uninsured or covered by Medicaid rose.
Higher rates of unmet prescription drug needs for people with private coverage are likely attributable to higher patient cost sharing. Between 2003 and 2007, average tiered copayments increased 20 percent or more for people with employer coverage.4 Plus, prescription drugs are typically excluded from health plan out-of-pocket spending limits, leaving people at risk for high costs if they need very expensive drugs or many prescriptions filled.5
Although rising prescription drug prices affect all users, the uninsured typically must pay full retail price for prescriptions. Many safety net providers provide some level of discounted or free medications for low-income, uninsured patients, but availability is often sporadic. The introduction of $4 generic drugs at major retailers has undoubtedly helped the uninsured, but these low prices apply to a limited number of drugs. And while pharmaceutical manufacturers offer assistance programs for uninsured and low-income people, the programs are limited and enrollment can be complicated.6
Back to Top
Income Levels and Chronic Conditions
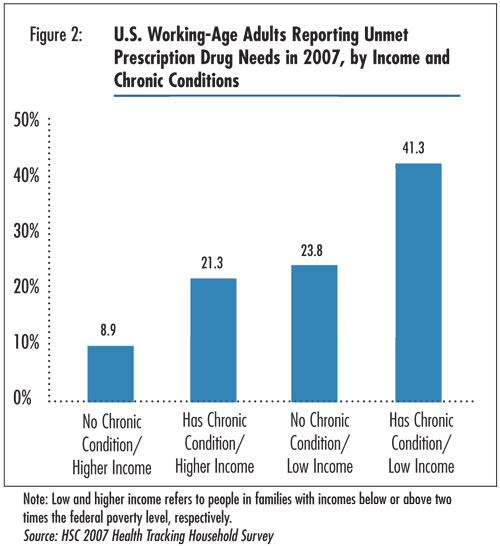
![]() wo key factors related to unmet needs for prescription drugs are the presence of chronic conditions and income level. Having at least one chronic condition more than doubles the likelihood of reporting unmet prescription drug needs. More than one in four working-age adults with a chronic condition (26.3%) reported unmet prescription drug needs in 2007, compared with 12.9 percent of people without a chronic condition. Unmet prescription needs are particularly high for adults with such conditions as diabetes, chronic obstructive pulmonary disease (COPD) and depression. And uninsured, working-age adults with one or more chronic conditions had the worst access across groups, with almost two-thirds reporting unmet prescription drug needs. People with chronic conditions are more likely to need multiple medications to manage their conditions, so rising prescription drug costs and changes in insurance coverage for prescription drugs affect them the most.
wo key factors related to unmet needs for prescription drugs are the presence of chronic conditions and income level. Having at least one chronic condition more than doubles the likelihood of reporting unmet prescription drug needs. More than one in four working-age adults with a chronic condition (26.3%) reported unmet prescription drug needs in 2007, compared with 12.9 percent of people without a chronic condition. Unmet prescription needs are particularly high for adults with such conditions as diabetes, chronic obstructive pulmonary disease (COPD) and depression. And uninsured, working-age adults with one or more chronic conditions had the worst access across groups, with almost two-thirds reporting unmet prescription drug needs. People with chronic conditions are more likely to need multiple medications to manage their conditions, so rising prescription drug costs and changes in insurance coverage for prescription drugs affect them the most.
Not surprisingly, low-income people—those in families with income less than 200 percent of the federal poverty level, or $41,300 for a family of four in 2007—reported greater difficulty affording prescription drugs than higher-income people. This reflects both their lower rates of insurance coverage and lower ability to bear the cost of insurance deductibles and copayments. In 2007, almost three in 10 low-income, working-age adults reported prescription drug access problems (29.8%), compared with 13.5 percent of higher-income, working-age adults.
In considering both chronic condition status and income together, more than four in 10 low-income people with chronic conditions reported unmet prescription drug needs in 2007, compared with 8.9 percent of higher-income people without chronic conditions (see Figure 2). There were statistically significant increases between 2003 and 2007 in unmet prescription drug needs among higher-income, working-age adults with and without chronic conditions, but increases for low-income groups were not statistically significant (findings not shown). Greater increases among higher-income people may indicate rising drug costs and prescribing rates, greater cutbacks in private insurance drug coverage relative to Medicaid drug coverage, and fewer options for higher-income uninsured people to qualify for assistance from drug manufacturers or safety net providers.
Back to Top
Click here to view this figure as a PowerPoint slide.
Implications
![]() he rising proportion of Americans who cannot afford prescription drugs is particularly troublesome because medications are increasingly important in treating many medical conditions, particularly chronic conditions. Moreover, patients who go without needed prescription drugs may experience worsening health and expensive complications. The most vulnerable people—those with low incomes, chronic conditions and the uninsured—continue to face the greatest unmet prescription drug needs. Yet, between 2003 and 2007, higher-income adults and those without chronic conditions experienced percentage point increases in unmet needs nearly as large as those with lower incomes and chronic conditions, respectively. This signals that prescription drugs are becoming more expensive for everyone and that insurance coverage provides less financial protection against out-of-pocket drug spending than it did in the past.
he rising proportion of Americans who cannot afford prescription drugs is particularly troublesome because medications are increasingly important in treating many medical conditions, particularly chronic conditions. Moreover, patients who go without needed prescription drugs may experience worsening health and expensive complications. The most vulnerable people—those with low incomes, chronic conditions and the uninsured—continue to face the greatest unmet prescription drug needs. Yet, between 2003 and 2007, higher-income adults and those without chronic conditions experienced percentage point increases in unmet needs nearly as large as those with lower incomes and chronic conditions, respectively. This signals that prescription drugs are becoming more expensive for everyone and that insurance coverage provides less financial protection against out-of-pocket drug spending than it did in the past.
The outlook for nonelderly Americans’ access to prescription drugs is not positive. The ability of many people to afford prescription drugs is likely to deteriorate as the economy continues to decline. The economic downturn will swell the ranks of the uninsured and place greater fiscal strains on state Medicaid budgets, likely leading to tightening of drug benefits and eligibility. Moreover, although industry experts predict spending growth for nonspecialty prescription drugs to remain relatively low over the next few years because of drug patent expirations, they expect spending growth for specialty drugs, which continue to gain importance in treatment regimens, to increase about 20 percent per year in the near future.7
Back to Top
Notes
Back to Top
Data Source and Funding Acknowledgements
This Tracking Report presents findings from the HSC 2007 Health Tracking Household Survey and the Community Tracking Study Household Surveys from 2000-01 and 2003. All three telephone surveys used nationally representative samples of the civilian, noninstitutionalized population. Sample sizes included about 60,000 people for the 2000-01 survey, about 47,000 people for the 2003 and about 18,000 people for the 2007 survey. Estimates are based on samples of about 9,600, 7,300 and 2,600 children in 2000-01, 2003 and 2007, respectively, and about 39,300, 29,900 and 10,400 working-age (19-64) adults, respectively. Response rates for the surveys were 59 percent in 2000-01, 57 percent in 2003 and 43 percent in 2007. Population weights adjust for probability of selection and differences in nonresponse based on age, sex, race or ethnicity, and education. Although all three surveys are nationally representative, the samples for the 2000-01 and 2003 surveys were largely clustered in 60 representative communities, while the 2007 survey was based on a stratified random sample of the nation. Standard errors account for the complex sample design of the surveys. Questionnaire design, survey administration and the question wording of all measures in this study were similar across the three surveys.
Estimates of unmet need for prescription drugs were based on the following question: "During the past 12 months, was there any time you needed prescription medicines but didn’t get them because you couldn’t afford it?" Insurance status reflects coverage on the day of the interview and includes coverage obtained through employer-sponsored and individually purchased private insurance, Medicare, Medicaid, the State Children’s Health Insurance Program (SCHIP), other state programs, TRICARE and other military insurance programs, and the Indian Health Service.
Funding Acknowledgements: This research was funded by the Robert Wood Johnson Foundation. The HSC 2007 Health Tracking Household Survey used for the analysis was sponsored by the Robert Wood Johnson Foundation.
Back to Top
TRACKING REPORTS are published by the
Center for Studying Health System Change.
600 Maryland Avenue, SW, Suite 550
Washington, DC 20024-2512
Tel: (202) 484-5261
Fax: (202) 484-9258
www.hschange.org