
Living on the Edge: Health Care Expenses Strain Family Budgets
HSC Research Brief No. 10
December 2008
Peter J. Cunningham, Carolyn Miller, Alwyn Cassil
Affordability of medical care is a central focus of health care reform efforts.
As health care costs continue to increase and the economy declines sharply,
there is very little cushion in family budgets for health care costs, even for
families with insurance coverage. Financial pressures on families from medical
bills increase sharply when out-of-pocket spending for health care services
exceeds 2.5 percent of family income, according to a new national study by the
Center for Studying Health System Change (HSC). Low-income families and people
in poor health experience financial pressures at even lower levels of spending,
largely because they have already accumulated large medical debts they are unable
to pay off. Many Californians also incur substantial burdens from health care
expenses, although the rate of medical bill problems is somewhat lower in California
compared with the overall United States. Extended interviews with a select number
of families facing problems with medical bills provide additional detail on
how families are forced to make difficult trade-offs with other family necessities,
put off paying other bills, cut down on other expenses and delay getting needed
medical care.
- Executive Summary (pdf)
- Affordable Medical Care Central to Health Reform
- Financial Pressures from Medical Expenses
- Modest Out-of-Pocket Expenses Cause Strain
- Medical Bill Problems Increase as Out-of-Pocket Spending Rises
- Difference by Income
- Health Status and Chronic Conditions
- Financial Consequences of Medical Bill Problems
- Consequences for Health and Medical Care
- Changes in Insurance Affect Financial Burden
- Economic Downturn and Medical Care Affordability
- Health Reform Implications
- Notes
- Data Source and Funding Acknowledgement
- Appendix
Affordable Medical Care Central to Health Reform
![]() s the national discussion focuses on health care reform
and the expansion of health insurance coverage, policy makers are considering
the important issue of subsidies to make health care more affordable to families.
Affordability has become a major concern because out-of-pocket spending on the
part of families for both health insurance premiums and deductibles, coinsurance
and other cost sharing for medical care has increased at much higher rates than
family incomes.1 The increased financial strain on families—including
many middle-income and insured families—means many families must make difficult
trade-offs with respect to other necessities, as well as increasingly delay
or go without needed medical care to avoid additional expenses.2
s the national discussion focuses on health care reform
and the expansion of health insurance coverage, policy makers are considering
the important issue of subsidies to make health care more affordable to families.
Affordability has become a major concern because out-of-pocket spending on the
part of families for both health insurance premiums and deductibles, coinsurance
and other cost sharing for medical care has increased at much higher rates than
family incomes.1 The increased financial strain on families—including
many middle-income and insured families—means many families must make difficult
trade-offs with respect to other necessities, as well as increasingly delay
or go without needed medical care to avoid additional expenses.2
There is little consensus among policy makers on how to set affordability standards in medical care, in part because there is little empirical evidence to guide these decisions. In addition, most of the policy focus has been on identifying affordability standards for insurance premiums, such as in the Massachusetts health reform, with much less attention on affordability standards for out-of-pocket spending on medical services. Some analysts propose setting affordability standards based on the current distribution of out-of-pocket spending for services, such as typical spending levels for a privately insured, middle-income population.3
However, a limitation with this approach is that unlike spending for premiums, mortgages, rents, and other household necessities, out-of-pocket spending on medical care is much less predictable, often unexpected and not entirely discretionary. While families may be able to budget for preventive and routine health care needs, high out-of-pocket medical spending by families is more often associated with urgent or serious health conditions, as well as provider recommendations for treatment, rather than discretionary patient choices. Thus, what people actually spend out of pocket on medical care reflects—at least in part—what they need or are prescribed, not necessarily what they can afford.
This study’s primary purpose was to identify the level of out-of-pocket medical expenses for health services that results in a large number of families experiencing financial difficulties with medical bills, with a goal of assisting policy makers in identifying and setting affordability standards for out-of-pocket spending. The study focuses on out-of-pocket spending for health services, which has received much less attention than out-of-pocket spending on health insurance premiums. The study’s objectives were to: (1) identify levels of annual out-of-pocket spending on health services associated with a high proportion of individuals reporting financial strains arising from medical bills; (2) describe in depth the difficult choices and trade-offs that families make in trying to pay their medical bills, as well as the consequences of these trade-offs; and (3) compare California and the general U.S. population in terms of problems paying medical bills (see Appendix). The findings are based on analysis of HSC’s 2007 Health Tracking Household Survey, a nationally representative survey of the U.S. population that also includes a representative sample of California residents, as well as in-depth interviews of 20 survey respondents who reported problems paying their medical bills (see Data Sources).
Back to Top
Financial Pressures from Medical Expenses
![]() revious HSC research has shown that about one in five Americans under
age 65 lived in families that had problems paying medical bills in 2007, a sizeable
increase from one in seven Americans in 2003.4 Follow-up interviews indicated
that medical bill problems result from a variety of situations, including out-of-pocket
spending for a specific surgery or treatment not covered by insurance; medical
services needed during times when the family was uninsured; and the accumulation
of regular ongoing, out-of-pocket medical expenses for insured people with chronic
medical conditions.
revious HSC research has shown that about one in five Americans under
age 65 lived in families that had problems paying medical bills in 2007, a sizeable
increase from one in seven Americans in 2003.4 Follow-up interviews indicated
that medical bill problems result from a variety of situations, including out-of-pocket
spending for a specific surgery or treatment not covered by insurance; medical
services needed during times when the family was uninsured; and the accumulation
of regular ongoing, out-of-pocket medical expenses for insured people with chronic
medical conditions.
Among the 20 percent of the nonelderly population with medical bill problems,
the level of financial strain and medical need varies greatly. Some respondents
reported severe financial pressures resulting from medical bills, often because
they were uninsured or underinsured and have chronic medical conditions that
require ongoing treatment. These individuals continue to accumulate medical
debt that they can’t pay off, and they must often choose between needed
medical care and food, rent, transportation costs and other basic necessities.
For example, a 47-year-old married California man accumulated medical debt of
close to $200,000. He lost his part-time job because of illness and city budget
cuts and has limited health benefits (designated as “20% disabled for life”)
through Veterans Affairs (VA). His wife is uninsured. The couple’s outstanding
medical debt increases every month because of medications for the wife and medications
and medical supplies for him that are not covered by his VA benefits. Unable
to pay off their outstanding debt, they are forced to make choices each month
between medical expenses and food, rent and gas.
For other individuals and families, the financial burden of health care is not quite as serious but still requires difficult choices. These respondents tended to be working, insured and generally did not have chronic or serious medical conditions. While they were not accumulating additional medical debt, ongoing medical expenses prevented them from saving—including for retirement or their children’s college expenses—and they often used savings, including retirement accounts, to pay down medical debt or out-of-pocket expenses. Medical expenses often compelled them to reduce other household expenses, make lifestyle changes, and forgo or delay routine medical care. Many indicated that their budgets are so tight that one large or unexpected expense or change in their situation—loss of a job, serious illness or change in insurance coverage—would put them over the edge into extreme financial trouble.
Back to Top
Modest Out-of-Pocket Expenses Cause Strain
![]() lthough financial difficulties with medical bills are often
associated with out-of-pocket expenses from catastrophic health events, most
people who reported problems paying medical bills had relatively modest levels
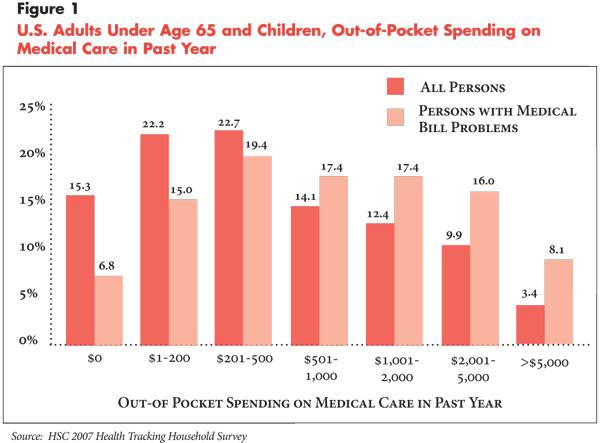
of out-of-pocket spending. The 2007 survey data show that about 40 percent of
people with medical bill problems had out-of-pocket expenditures of $500 or
less in the previous year, and 59 percent had out-of-pocket expenditures of
$1,000 or less (see Figure 1). Less than 10 percent of
those with medical bill problems had out-of-pocket expenditures of $5,000 or
more.
lthough financial difficulties with medical bills are often
associated with out-of-pocket expenses from catastrophic health events, most
people who reported problems paying medical bills had relatively modest levels
of out-of-pocket spending. The 2007 survey data show that about 40 percent of
people with medical bill problems had out-of-pocket expenditures of $500 or
less in the previous year, and 59 percent had out-of-pocket expenditures of
$1,000 or less (see Figure 1). Less than 10 percent of
those with medical bill problems had out-of-pocket expenditures of $5,000 or
more.
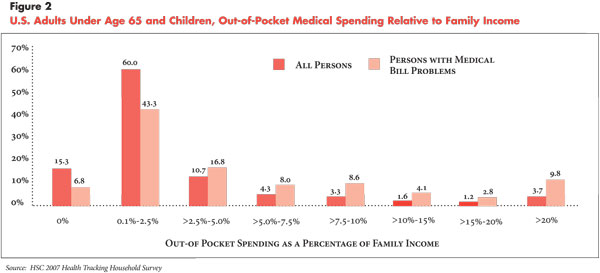
Logically, even this small to modest level of out-of-pocket spending is likely to be a financial hardship for low-income people because it represents a higher percentage of their discretionary income compared with higher-income people. Therefore, a more accurate indicator of the financial burden of medical care relates out-of-pocket spending to family income. Compared with the overall population, people with medical bill problems were more likely to have high out-of-pocket expenses relative to family income, although most still had relatively low spending levels. About half of those with medical bill problems spent 2.5 percent or less of family income on out-of-pocket medical expenses, and more than two-thirds spent 5 percent or less (see Figure 2). Only about 10 percent of those with medical bill problems had extremely high levels of out-of-pocket spending—20 percent or more of family income.
The survey findings suggest that many families have very little cushion in their household budgets for large or unexpected out-of-pocket spending on health care, a conclusion strongly supported by the in-depth respondent interviews. Most respondents who weren’t already in dire financial straits believed that they are just one adverse event—such as a loss of their job or health insurance or an unexpected illness or accident—away from financial catastrophe.
For example, a 51-year-old divorced mother of two in Massachusetts was covered through her employer, and her children were covered through their father’s employer. Yet, out-of-pocket medical expenses and dental and vision care—not covered by insurance—for her and her children often push her close to the financial edge. She worked several part-time jobs to cover her costs and struggles financially:
“Did it (medical debt) put me in the position of losing my house? No, because it wasn’t thousands and thousands and thousands of dollars. But it definitely put me in a dicey position, and had I been really sick, then we would have been in real trouble. And I think a lot of people are in that same boat. We’re all one broken leg, one bad fall or one case of pneumonia away from the house of cards completely falling down.”
Another typical situation was a teacher in California, who has three children—all with private insurance coverage—and earns about $55,000 a year. They have little discretionary income left each month after mortgage, utility, food, clothing and transportation payments. While the respondent described his insurance coverage as “pretty good,” and it includes some dental and vision coverage, his medical bill problems resulted from dental work for his children that was not fully covered by insurance, as well as copayments of about $80 a month for his prescription drugs for hypertension and high cholesterol. While these expenses haven’t caused severe financial problems for the family, they have caused him to be late occasionally on the mortgage and other bills, to finance some of his medical expenses on credit cards, and to cut down on other expenses, such as clothing.
Back to Top
Medical Bill Problems Increase as Out-of-Pocket Spending Rises
![]() deally, affordability standards should take into account the number
of people who experience financial strain at different levels of out-of-pocket
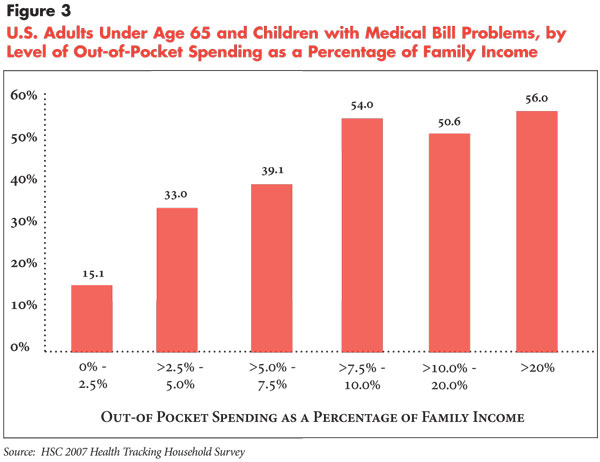
spending. While 20.9 percent of all people under age 65 are in families that
had problems paying medical bills, the proportion with medical bill problems
increases along with the level of out-of-pocket spending.
deally, affordability standards should take into account the number
of people who experience financial strain at different levels of out-of-pocket
spending. While 20.9 percent of all people under age 65 are in families that
had problems paying medical bills, the proportion with medical bill problems
increases along with the level of out-of-pocket spending.
Most notably, there is a sizeable increase in the rate of medical bill problems when spending exceeds 2.5 percent of income, from 15.1 percent reporting medical bill problems when spending is less than 2.5 percent of income to 33 percent reporting medical bill problems when spending is between 2.5 and 5 percent of income (see Figure 3). More than half reported medical bill problems by the time spending reached 7.5 percent to 10 percent of family income.
Back to Top
Difference by Income
![]() ven when affordability standards directly relate out-of-pocket spending
to family income, low-income families likely experience greater financial strain
at very low levels of spending since they tend to pay a higher percentage of
their income on other necessities and have little or no discretionary income
available for medical care.
ven when affordability standards directly relate out-of-pocket spending
to family income, low-income families likely experience greater financial strain
at very low levels of spending since they tend to pay a higher percentage of
their income on other necessities and have little or no discretionary income
available for medical care.
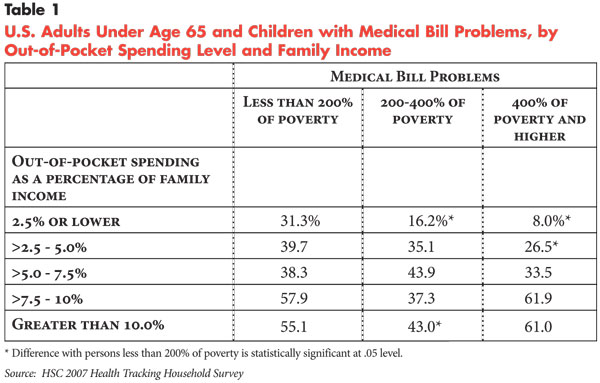
Indeed, about one-third of low-income people, those with family incomes below 200 percent of poverty, or $41,300 for a family of four in 2007, reported medical bill problems at the lowest levels of out-of-pocket spending—less than 2.5 percent of family income—compared with 16.2 percent for moderate-income families (200-400 percent of poverty) and 8 percent for higher-income families (see Table 1). When out-of-pocket spending exceeds 2.5 percent of family income, rates of medical bill problems become more similar across income levels and are even slightly higher among high-income people when spending exceeds 7.5 percent of family income.
Many low-income people have difficulty affording even small amounts of out-of-pocket spending because they have accumulated large medical debts in previous years. For example, a Texas family with an annual income of $11,000 experienced serious financial strain almost entirely because of debts incurred several years previously from the birth of a child—$3,500 in anesthesiologist costs not covered by Medicaid—an emergency room visit and a related ambulance charge. Similarly, a single mother in Pennsylvania on public assistance had accumulated medical debt of about $10,000, first incurred more than five years ago. Both families’ out-of-pocket spending in the year prior to the survey was only $100, but they both have been unable to make any headway in paying off their debts, resulting in numerous contacts with collection agencies and severely damaged credit.
Thus, low-income people are likely to view any level of out-of-pocket spending
as “unaffordable” if they are already burdened with large medical
debt. The survey data confirm that medical bill problems among low-income people
tend to be related to previously accumulated large debts to a higher degree
than other income groups.
Back to Top
Health Status and Chronic Conditions
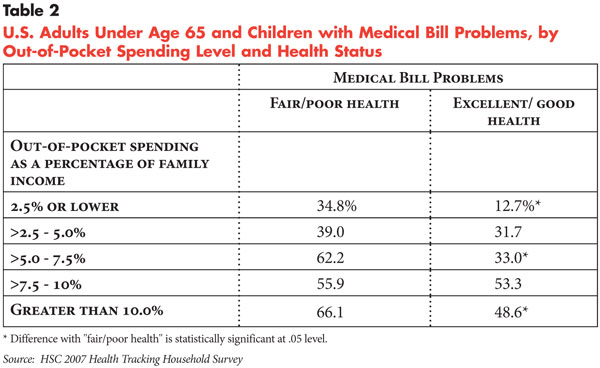
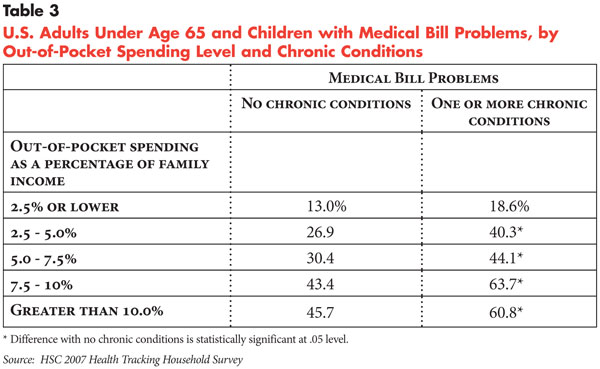
![]() n general, people in poor health or with multiple chronic
conditions have lower thresholds of affordability compared with healthier people.
About one-third of people in fair or poor health had problems with medical bills
at the lowest level of spending—less than 2.5 percent of income compared
with 12.7 percent of people in good or excellent health (see Table
2). In fact, higher proportions of people in fair or poor health have medical
bill problems at all levels of out-of-pocket spending compared with people in
good health. Similarly, people with chronic conditions are more likely to have
medical bill problems at all levels of out-of-pocket spending compared with
people without chronic conditions (see Table 3).
n general, people in poor health or with multiple chronic
conditions have lower thresholds of affordability compared with healthier people.
About one-third of people in fair or poor health had problems with medical bills
at the lowest level of spending—less than 2.5 percent of income compared
with 12.7 percent of people in good or excellent health (see Table
2). In fact, higher proportions of people in fair or poor health have medical
bill problems at all levels of out-of-pocket spending compared with people in
good health. Similarly, people with chronic conditions are more likely to have
medical bill problems at all levels of out-of-pocket spending compared with
people without chronic conditions (see Table 3).
The in-depth interviews indicated that affordability concerns for people with chronic conditions and poor health are often compounded by low or limited incomes, an inability to work, no access to job-based health benefits and large prior medical debts. Even when they have insurance, patient cost sharing for frequent office visits, specialists and prescription medications tax limited financial resources. In some cases, they are simply unable to manage their medical condition as aggressively as they would like because they cannot afford the medical care they need. Such a situation can create a perfect storm of financial troubles that also exacerbate health problems. For example, a 52-year-old Illinois man accumulated $6,000 in medical debt related to an injury he sustained while on vacation. He eventually had to quit his job and could not afford the continuation coverage available through his former employer. He dropped his insurance and moved in with his mother to cover his other expenses.
Some of the respondents with chronic conditions were disabled and covered by Medicare but often have medical expenses that are not covered by Medicare. One 59-year-old woman with multiple chronic conditions received Social Security disability benefits and Medicare coverage, and her out-of-pocket expenses used to be paid for by a supplemental assistance program through a local hospital. However, after the hospital eliminated eligibility for the assistance program for Medicare patients, she accumulated about $3,000 in debt because of noncovered expenses. And her debt continued to grow because of her fixed income and ongoing medical needs.
Back to Top
Financial Consequences of Medical Bill Problems
![]() ll of the 20 people included in the in-depth interviews experienced
some financial consequences as a result of their problems with medical bills.
The severity of the financial problems caused by medical expenses varied, with
the largest distinctions between insured middle-income families and lower-income
families who were uninsured or underinsured.
ll of the 20 people included in the in-depth interviews experienced
some financial consequences as a result of their problems with medical bills.
The severity of the financial problems caused by medical expenses varied, with
the largest distinctions between insured middle-income families and lower-income
families who were uninsured or underinsured.
Although many middle-income families with insurance struggled to balance competing demands on limited financial resources, they managed to keep on top of medical expenses and some could make payments to reduce outstanding medical debt. These respondents were making every attempt to protect their homes, credit and basic financial stability by going without medical services they couldn’t afford, delaying or making minimum payments on other bills, and cutting back on all household and personal expenses.
A few respondents reported that they “pay off” their outstanding medical debt and medical expenses with credit cards but then cannot afford to pay the credit card bill. One respondent indicated that he had taken out two loans to pay off his medical debt—a home equity loan and a personal loan. Within a few months, the credit card debt had re-accumulated because he could not afford the payments. A few respondents reported refinancing their homes to pay medical expenses. One respondent reported refinancing her home to pay off $10,000 in medical bills from noncovered outpatient surgery—the insurance company denied coverage contending the care was for a pre-existing condition—and she now struggles with the higher mortgage payment.
As mentioned previously, many of the lower-income families that were uninsured or underinsured had large medical debts from prior years. Most of these respondents were close to giving up and were not even dealing with the debt on a monthly basis because they simply couldn’t afford to make any payments. For these respondents, the debt “just hangs” over their heads, and they are resigned to a bad credit rating, trying to ignore or avoid collection agencies—and in a few cases—moving in with family members. These families face extreme choices between paying for medical care and other basic necessities. One California woman described the choice as either paying medical expenses or keeping her children:
“I was unable to make the payments (toward medical debt). It was either you buy groceries and pay rent or you pay the debt. I need a roof over my kids’ heads. I need groceries for the refrigerator because…here in California, if you don’t have electricity, if you don’t have food in the refrigerator or the cupboard to provide for those kids, social services finds out and they come and pick up your kids.”
Back to Top
Consequences for Health and Medical Care
![]() revious HSC research has shown that the increase in the
proportion of Americans reporting problems paying medical bills was the primary
reason for an increase in insured people delaying or going without needed medical
care in recent years.5
revious HSC research has shown that the increase in the
proportion of Americans reporting problems paying medical bills was the primary
reason for an increase in insured people delaying or going without needed medical
care in recent years.5
When families face high medical expenses or debt, they often delay or forgo medical care to avoid incurring additional expenses they can’t afford. Respondents to the in-depth interviews reported delaying or going without routine or preventive medical care, as well as specialty services, such as mental health care, physical therapy, pain management, dental care, and—for one respondent—not participating in a clinical trial for cancer treatment because it was not covered by insurance.
Dental problems appeared to be common among respondents or family members because many lacked dental insurance and even those with dental insurance seemed to view dental care as less important than other priorities when faced with financial problems. Orthodontic care also posed substantial financial difficulty for many because of limited coverage. Several respondents reported that their monthly debt payments increased substantially because of these costs, or they delayed the care until they could afford it, or they simply had to do without because they could not afford it.
Financial difficulties with medical bills resulted in high levels of psychological stress for some respondents, although the financial problems that caused the stress also prevented them from seeking treatment. Other respondents with health problems reported that cutting back on health care was negatively affecting their health and, in some cases, their ability to work and perform other activities of daily living.
For example, an uninsured woman could not afford all of the medications needed to treat her chronic conditions because of her medical debt. The irony is that while large debt created barriers to adequate treatment for her health problems, these same problems were preventing her from re-entering the workforce, which would have increased her income and enabled her to start paying off her debts.
“By me being on a fixed income, I have to live on a certain amount of money…I’m falling farther into debt and I have medical problems on top of that. I do want to go back to work but I was trying to get my medical problems taken care of first. I want to pay them (medical bills), but I can’t pay them until I go back to work. But if I go get a job and then I’ve got to go to a doctor four times or five times out of a month…some jobs don’t want you to come to work with medical problems. I probably wouldn’t get the job anyway.”
Underscoring the importance of both informal support from providers and the health care safety net, some respondents reported that they received help from the medical community through reduced or waived fees, lenient payment arrangements and, in a few cases, health care providers even making house calls. Some respondents also reported turning to free clinics and other providers that charge fees based on a sliding scale to obtain more affordable care, including county health departments and other publicly sponsored clinics, university clinics for dental care, and discount stores for eye exams.
Back to Top
Changes in Insurance Affect Financial Burden
![]() or many respondents, changes in health insurance coverage resulted
in big changes in the family’s financial situation, both positive and negative.
Sometimes gaining insurance coverage or changing to an insurance plan with lower
cost sharing provided families the boost needed to get out of debt or manage
their medical expenses. For example, one family was able to change to an insurance
plan with much lower deductibles and cost sharing through the wife’s workplace,
which she became eligible for by increasing the number of hours she worked.
This change provided enough of a cushion to allow them to start paying off their
debt:
or many respondents, changes in health insurance coverage resulted
in big changes in the family’s financial situation, both positive and negative.
Sometimes gaining insurance coverage or changing to an insurance plan with lower
cost sharing provided families the boost needed to get out of debt or manage
their medical expenses. For example, one family was able to change to an insurance
plan with much lower deductibles and cost sharing through the wife’s workplace,
which she became eligible for by increasing the number of hours she worked.
This change provided enough of a cushion to allow them to start paying off their
debt:
“It was a huge blessing to go on my insurance. With his (husband’s) insurance there was a $5,000 deductible, which killed us. It’s a good thing we switched to my insurance because if that (last four years of medical problems) had been on his (insurance)—$5,000 deductible each year and I went through it for four years—we would really be in trouble. If we had not been able to switch insurance, we wouldn’t have been able to pay off the debt.”
On the negative side, the loss of insurance or an increase in cost sharing can sometimes push a family that was just getting by financially into a completely untenable financial situation.
Back to Top
Economic Downturn and Medical Care Affordability
![]() he survey data—collected between April 2007 and January 2008—predated
the economic downturn, mortgage and financial crisis, high fuel costs and other
inflation that has occurred in 2008 and, therefore, likely understates both
the extent and severity of medical bill problems that families are currently
experiencing.
he survey data—collected between April 2007 and January 2008—predated
the economic downturn, mortgage and financial crisis, high fuel costs and other
inflation that has occurred in 2008 and, therefore, likely understates both
the extent and severity of medical bill problems that families are currently
experiencing.
All of the respondents to the in-depth interviews—conducted in September 2008—reported feeling the effects of the worsening economy over the past year, especially the increase in fuel costs. In general, as expenses related to fuel, food and other necessities increased, families struggled harder to meet out-of-pocket medical expenses and pay off medical debt. In many cases, they delayed or went without medical care to offset other expenses. Virtually all respondents were cutting back on expenses in some way and reducing savings. There were also some indications that higher fuel costs were increasing barriers to care, especially for people in rural areas or small towns with limited medical facilities. For example, one person who receives care at a VA facility 90 miles from her home had to cancel appointments because she couldn’t afford to pay for gas.
Back to Top
Health Reform Implications
![]() he findings from both the survey data and the in-depth interviews
indicate that families have very little cushion in their household budgets to
incur large out-of-pocket medical expenses. Overall, more families experience
serious financial problems with medical bills when out-of-pocket medical spending
exceeds 2.5 percent of family income. However, even this level of out-of-pocket
spending is likely to be unaffordable for many low-income families—especially
those with significant medical needs—with substantial medical debt. Because
of their precarious financial situation and limited incomes—often made
worse by illness and medical debt—caution is in order before imposing even
minimal cost sharing on low-income families.
he findings from both the survey data and the in-depth interviews
indicate that families have very little cushion in their household budgets to
incur large out-of-pocket medical expenses. Overall, more families experience
serious financial problems with medical bills when out-of-pocket medical spending
exceeds 2.5 percent of family income. However, even this level of out-of-pocket
spending is likely to be unaffordable for many low-income families—especially
those with significant medical needs—with substantial medical debt. Because
of their precarious financial situation and limited incomes—often made
worse by illness and medical debt—caution is in order before imposing even
minimal cost sharing on low-income families.
Of course, determining the affordability threshold for out-of-pocket medical spending must be done within a context of affordability standards for health insurance premium payments. Health plans and policy makers may choose to keep patient cost sharing for services low in part by charging higher premiums. This may be a particularly attractive option for people with significant medical needs who prefer more predictable monthly premium payments—even if financially stressful—than much less predictable out-of-pocket costs for care. Alternatively, enrollees who pay lower premiums may be able to afford somewhat higher cost-sharing thresholds for services. It was beyond the scope of this study to explore the appropriate mix of out-of-pocket spending for premiums and services.
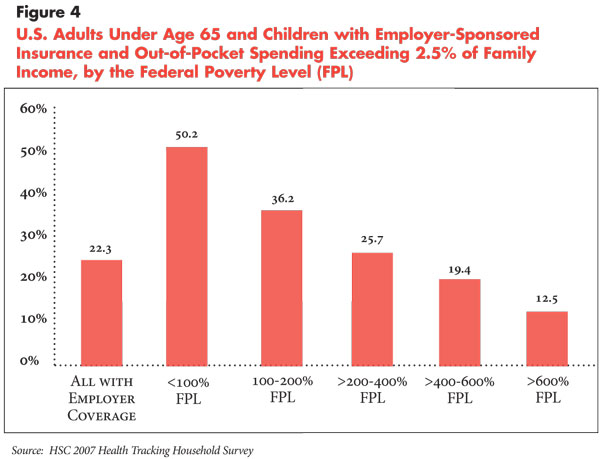
What do these affordability standards imply in terms of current cost-sharing requirements in employer-sponsored health plans? Recent employer surveys show that cost-sharing requirements in the form of deductibles and copayments have been increasing in recent years.6 About 80 percent of plans also have out-of-pocket maximums, beyond which enrollees are not expected to pay any of the costs for covered medical services, but the limits typically don’t apply to prescription drugs. For plans with out-of-pocket maximums, the median amount in 2008 was $2,000 for single coverage and $4,000 for family coverage. To fall below the threshold of 2.5 percent of family income, families meeting or exceeding these out-of-pocket maximums would require an annual income of $80,000 for single coverage—more than seven times the poverty level for a single person—and $160,000 for family coverage—more than seven times the poverty level for a family of four.
In terms of what people with employer-sponsored coverage are actually spending out of pocket for services, 22.3 percent currently spend more than 2.5 percent of family income (see Figure 4). However, this varies considerably by family income, ranging from about half of people below the federal poverty level spending more than 2.5 percent of family income to only 12.5 percent at income levels of 600 percent of poverty or higher. Thus, setting cost-sharing affordability standards at 2.5 percent of family income or lower for employer-sponsored plans would by far have the largest impact on low-income families.
Most health reform plans focus on the affordability of health insurance premiums, with the amount of premium subsidies based directly on family income. There has been much less attention concerning affordability of out-of-pocket expenditures for services. One exception is the Commonwealth Care program in Massachusetts, part of the 2006 state health reform legislation, that provides subsidized insurance for low- and moderate-income people—up to 300 percent of the federal poverty level. In addition to premium amounts based on family income, cost sharing for services and out-of-pocket limits also vary by family income, with very little or no cost sharing required for people with family incomes below the federal poverty level. However, cost-sharing limits are based on broad income categories—rather than defined as a share of family income. As currently structured, the financial burden of out-of-pocket expenses can vary considerably depending on whether one is at the lower or higher end of an income group.
Medicaid and the State Children’s Health Insurance Program (SCHIP) probably have gone the farthest in terms of limiting all out-of-pocket spending—premium contribution and patient cost sharing—to a percentage of family income. While states have considerable flexibility in requiring premium contributions and patient cost sharing, total out-of-pocket spending cannot exceed 5 percent of family income for enrollees earning 150 percent of the federal poverty level or more. The findings in this report suggest that this threshold of out-of-pocket spending may be too high for low-income persons, and research has indicated that such cost sharing in Medicaid and SCHIP tends to discourage enrollment.7
The decreasing affordability of health care for families is directly related to the more general trend of overall health care costs increasing much faster than gross domestic product (GDP) and family incomes since the late 1990s.8 In the early and mid-1990s, the nation experienced a brief period of relatively slow growth in health care costs largely because of the rise of tightly managed care, which contained health care costs through greater restrictions on service use and enrollee choice of providers. However, the most highly restrictive forms of managed care were broadly rejected and there has been little effective constraint on health care costs over the past decade other than increased patient cost sharing. Increased financial responsibility for health care costs on the part of patients, including the promotion of consumer-directed health plans, is currently the primary method being used to contain health care costs.
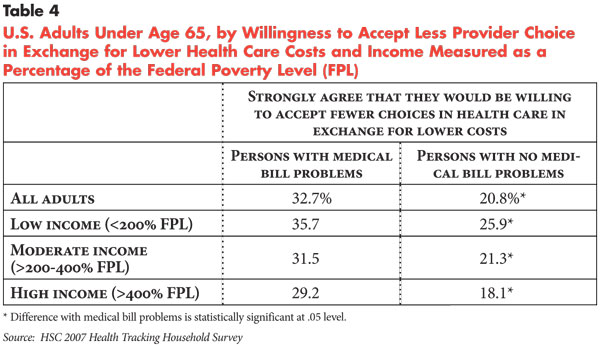
Given that most families have a decreasing ability to take on more financial responsibility for their health care, is the nation ready to return to more tightly managed care as a way to contain and lower health care costs for families? The survey data suggest a mixed picture. In response to a question about whether they would be “willing to accept a limited choice of physicians and hospitals if I could save money on my out-of-pocket costs for health care,” people with medical bill problems were more likely to “strongly agree” with the statement (32.7%) compared with people without medical bill problems (20.8 %) (see Table 4). On the other hand, different attitudes between people with and without medical bill problems on the “choice-cost” trade-off—as well as differences among people at different income levels—are not as great as one might expect, suggesting that a return to health plans that limit patient choice would not be enthusiastically embraced by much of the population.
Nevertheless, there are few other options in the immediate future to relieve
the financial pressure on families. Achieving affordability thresholds of 2.5
percent of family income would likely require additional subsidies or expenditures
on the part of private and public purchasers of coverage. This is likely to
be unsustainable at a time when annual health care spending continues to exceed
growth in GDP by a wide—and increasing—margin as the economy declines.
Moreover, the economic downturn and financial crisis are putting considerable
pressure on state and federal budgets, as well as corporate bottom lines. Reducing
or removing cost constraints on families without any system-wide effort to contain
costs would only worsen the current problems. Ultimately, an important part
of the solution is the ability to distinguish between high-value health care—care
that is effective and should be covered—and health care services that are
ineffective and wasteful. Such efforts, however, are in the early stages of
development and will not provide immediate relief to families.
Back to Top
Notes
Back to Top
Data Source
The survey data used in this report are from HSC’s 2007 Health Tracking Household Survey, a nationally representative telephone survey of the U.S. population conducted between April 2007 and January 2008. The sample includes about 18,000 people, and the response rate was 43 percent. The sample for this study was all people under age 65, or about 14,500 people. Population weights adjust for probability of selection and differences in nonresponse based on age, sex, race/ethnicity and education. Standard errors account for the complex sample design of the survey.
The survey also includes a representative sample of about 1,600 people in California, including about 1,400 persons under age 65. Survey weights for the California sample were designed to reflect population totals for the state and also adjust for differences in nonresponse based on age, sex, race/ethnicity and education.
The survey asked the question, “During the past 12 months have you or your family had any problems paying medical bills?” The survey also asked about total family out-of-pocket expenditures for medical services in the year prior to the survey. This report takes the perspective that it is more appropriate to observe medical bill problems at the family level because decisions on major expenses and finances—including medical care—are usually made at the family level. This also implies that the negative effects of medical bill problems in the family will affect all family members, rather than just the individual(s) within the family who incurred the medical bills. For this reason, the response to the questions on medical bill problems and out-of-pocket expenditures—asked only once per family—are applied to all persons in the family. The estimates reflect the percentage of people in families with medical bill problems and/or at a given level of out-of-pocket spending.
In September 2008, 20 in-depth interviews were completed with respondents
from the 2007 Health Tracking Household Survey who reported problems paying
medical bills (based on the survey question); five interviews with respondents
in California and 15 with respondents in the remainder of the United States.
While not statistically representative, the sample of respondents for the in-depth
interviews was selected to reflect a broad cross-section of individuals based
on their insurance coverage, socioeconomic status, family type, race/ethnicity,
severity of medical bill problems (based on total medical debt at the time of
the survey), and region of the country. The interviews were open-ended and semi-structured
and were guided by the use of interview protocols.
Funding Acknowledgement:
This research was funded by the Blue Shield of California Foundation. The HSC 2007 Health Tracking Household Survey used for the analysis was sponsored by the Robert Wood Johnson Foundation.
Back to Top
Appendix - A Comparison of California and the United States
While many California families are shouldering a difficult burden of out-of-pocket medical costs, the problem looks different in the nation’s largest state—for a wide range of reasons. A smaller percentage of nonelderly Californians reported problems paying medical bills compared with the U.S. population—13.5 percent with medical bill problems in California compared with 20.9 percent nationally (see Appendix Table). Most of the difference in the prevalence of medical bill problems occurs at lower levels of spending: 7.7 percent of Californians who spent less than 2.5 percent of income had medical bill problems, compared with 15.1 percent of all Americans. When out-of-pocket spending exceeds 5 percent of family income, prevalence of medical bill problems is comparable between California and the total United States.
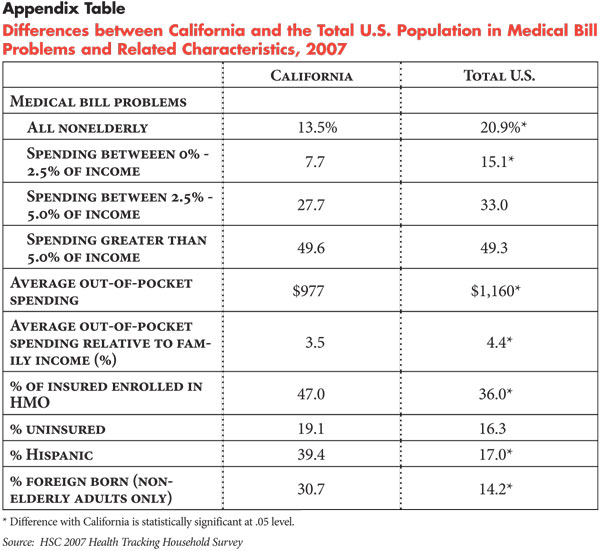
Fewer medical bill problems in California likely reflect the fact that average annual out-of-pocket spending for medical services is lower in California ($977) compared with the overall U.S. population ($1,160). Lower out-of-pocket spending in California is consistent with the fact that total per capita health spending in California tends to be lower than the U.S. average—$4,638 per capita in California vs. $5,283 for the nation in 2004—according to the Centers for Medicare and Medicaid Services, National Health Accounts.
Lower spending in California reflects a number of factors, including a higher percentage of insured persons enrolled in health maintenance organizations (HMOs) (47% in California vs. 36% nationally). Compared with preferred provider organizations, for example, HMOs generally have less patient cost sharing.
Also, California has a number of population characteristics that are associated with lower health care use and less health spending. For example, California has a somewhat higher percentage of uninsured (19%) compared with to the overall U.S. population (16%). Uninsured people use fewer services because of financial barriers to care and, therefore, incur fewer expenses relative to insured people. In addition, California has a much higher percentage of Hispanics (39%), which is more than double that of the general U.S. population, as well as a higher percentage of recent immigrants. Overall, recent Hispanic immigrants use less health care and incur fewer out-of-pocket expenses, even after accounting for differences in health insurance coverage and income. Other than financial barriers to care, Hispanics often encounter access barriers because of language and immigration status. Lower health care use among recent immigrants reflects in part that they tend to be healthier, but also are less acculturated into U.S. society and less familiar with the health care system, predisposing them to use less care.
Nevertheless, the experiences of Californians with problems paying medical bills are similar to the nation in general. Five of the 20 in-depth interviews were conducted with respondents from California who varied by age, gender and race/ethnicity, as well as their financial and health care circumstances.
Three of the respondents reported extreme financial difficulties because of medical expenses, limited income, limited or no health insurance coverage, and chronic conditions or serious medical problems:
- A 35-year-old single woman with two teen-agers indicated that her debt of $10,000 resulted from emergency room visits a few years ago for her daughter. She is currently insured through her employer but cannot afford to cover the children, and her income is too low for her to pay anything toward her debt. She feels her choice is to provide for her children (to avoid their removal by social services) or make payments on her medical debt.
- A 47-year-old married man who is on disability and has limited health insurance benefits through the VA reported medical debt of close to $200,000. He has accumulated this level of debt because of his low income, his chronic conditions and his wife’s lack of insurance. Although he tries to make payments, he continues to incur additional debt and is forced to choose each month among food, rent, gas and medical expenses.
- A 43-year-old married man with three children is on disability. His wife works and is insured through her employer, but he and the children are uninsured. He cannot afford routine/preventive care for himself or the children and has outstanding debt he is trying to pay off. He declared bankruptcy several years ago (not because of medical debt) and is still struggling financially.
The remaining two respondents reported less dire but still fairly serious financial difficulties. For these respondents with income and insurance, financial problems resulted from large medical debt or out-of-pocket costs for noncovered care. Keeping up with these expenses and/or making payments on outstanding debt creates financial difficulty for these families and often forces them to delay or forgo some routine/preventive medical care:
- A 50-year old-single man with three children has insurance through his job and no one in his family has a serious chronic illness or medical problem, although he takes medications for hypertension and high cholesterol. The children need routine/preventive care, dental work, vision care, and braces and handling these expenses (copayments, premiums and noncovered expenses) has pushed him into medical debt.
- A 34-year-old married woman with one child has thousands of dollars in debt from the birth of her child. They were managing financially until they found out that the only hospital in their town no longer accepts their insurance. The hospital has presented them with bills for the hospital and anesthesiologist from the birth even though they were insured at the time. She is making payments on her debt (sometimes on a credit card) and does not have other serious financial problems. She works part time and her husband works full time and the family does not have any chronic conditions.
Back to Top
ISSUE BRIEFS are published by the Center for Studying Health System
Change.
600 Maryland Avenue, SW, Suite 550
Washington, DC 20024-2512
Tel: (202) 484-5261
Fax: (202) 484-9258
www.hschange.org