
Physician Financial Incentives: Use of Quality Incentives Inches Up, but Productivity Still Dominates
Issue Brief No. 108
January 2007
James D. Reschovsky, Jack Hadley
The proportion of physicians in group practice whose compensation is based in part on quality measures increased from 17.6 percent in 2000-01 to 20.2 percent in 2004-05, according to a new national study from the Center for Studying Health System Change (HSC). Despite this small but statistically significant increase, quality-related physician compensation is much less common than financial incentives tied to physicians’ individual productivity, which has consistently affected 70 percent of physicians in non-solo practice since 1996-97. Examining the trend in quality-related physician compensation since 1996-97 suggests that quality incentives are most prevalent among primary care physicians and in large practices that receive a substantial share of revenue from capitated payments, or fixed per patient, per month payments.
- Productivity-based Compensation Dominates Practice-Level Financial Incentives
- Quality Incentives More Common in Some Practices
- Rise in Quality-based Incentives
- Policy Implications
- Notes
- Data Source
Productivity-Based Compensation Dominates Practice-Level Financial Incentives
![]() ontinuing concern about low-quality medical care has led
both private and public payers to explore using financial incentives to encourage
hospitals and physicians to improve their quality of care.1
Many of these approaches, such as pay for performance (P4P), are motivated by
the fact that existing payment systems compensate physicians equally regardless
of the appropriateness or quality of care their patients receive.2
ontinuing concern about low-quality medical care has led
both private and public payers to explore using financial incentives to encourage
hospitals and physicians to improve their quality of care.1
Many of these approaches, such as pay for performance (P4P), are motivated by
the fact that existing payment systems compensate physicians equally regardless
of the appropriateness or quality of care their patients receive.2
There has been little change since 1996-97 in the types of practice-level financial incentives physicians practicing in groups of two or more face,3 according to HSC’s 2004-05 nationally representative physician survey (see Data Source). About one in four physicians (23.5%) in non-solo practice do not have their compensation tied to any explicit financial incentives.
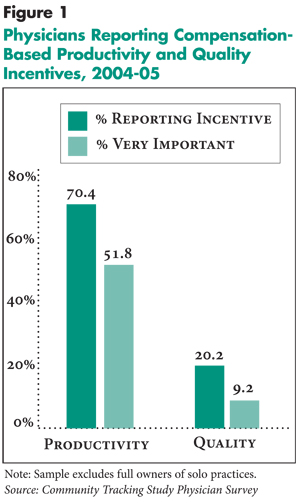
Compensation based on individual productivity remained physicians’ predominant financial incentive in 2004-05, affecting 70.4 percent of physicians. In 2004-05, 20.2 percent of physicians reported that quality measures were taken into account in determining their compensation, a statistically significant increase from 2000-01, when 17.6 percent of physicians reported quality-based compensation.4 Nevertheless, nearly all physicians with quality incentives also face productivity incentives.
Other incentives used by physician practices include tying individual physician’s base compensation and/or bonuses to results of patient satisfaction surveys and profiling that compares a physician’s pattern of medical resource use to that of other physicians. In 2004-05, 24.6 percent of physicians faced financial incentives related to patient satisfaction surveys and 13.9 percent had their compensation tied to profiling
A closer examination of the 2004-05 data illustrates the large gap between the importance of productivity-based and quality-based financial incentives (see Figure 1). Nearly three in four physicians who reported facing productivity-based financial incentives, or 52 percent of all physicians, view these incentives as a very important factor determining their compensation.
In contrast, 44 percent of physicians subject to quality-related incentives view these incentives as very important to their compensation, or just 9 percent of all physicians. A roughly equal number report that quality is moderately important to their total compensation. Even smaller proportions of physicians reporting financial incentives tied to patient satisfaction surveys or profiling regard them as very important to their total compensation.
Back to Top
 |
Click here to view this figure as a PowerPoint slide.
Quality Incentives More Common in Some Practices
![]() lthough productivity is broadly used to determine physician
compensation across nearly all types of physicians and physician practices,
the prevalence of quality-related compensation varies across specialties and
practice type. Established quality indicators are most common in primary care
and for the treatment of chronic conditions. Reflecting this, quality-related
compensation is more common among primary care physicians than specialists.
Among primary care practitioners, quality incentives are more common among those
treating adults (general internists and family or general practitioners) than
pediatricians—30.4 percent vs. 20.7 percent (see Table 1).
And, quality incentives are more common among medical specialists than surgical
specialists—17.8 percent vs. 12.6 percent.
lthough productivity is broadly used to determine physician
compensation across nearly all types of physicians and physician practices,
the prevalence of quality-related compensation varies across specialties and
practice type. Established quality indicators are most common in primary care
and for the treatment of chronic conditions. Reflecting this, quality-related
compensation is more common among primary care physicians than specialists.
Among primary care practitioners, quality incentives are more common among those
treating adults (general internists and family or general practitioners) than
pediatricians—30.4 percent vs. 20.7 percent (see Table 1).
And, quality incentives are more common among medical specialists than surgical
specialists—17.8 percent vs. 12.6 percent.
Physicians in larger group practices, as well as hospital, medical school or other institutional practices, are more likely to be compensated in part on the basis of quality than physicians in small or medium-sized group practices. Physicians in group/staff model health maintenance organizations (HMOs), who represent only 6 percent of physicians in non-solo practice, are at one extreme. Nearly two-thirds reported that quality measures affect their compensation, with more than a quarter reporting that quality is a very important factor in determining their compensation.
Health plan payment to medical practices on the basis of capitation—fixed per patient, per month payments—is often matched with practice-level incentives or requirements concerning quality of care. These incentives appear to be passed onto physicians by group practices. Compensation of physicians on the basis of quality is nearly three times as prevalent in physician practices that receive more than 20 percent of revenue in capitated payments than among physicians in practices with 5 percent or less in capitated revenue.
The growth between 2000-01 and 2004-05 in the percentage of physicians with quality-related compensation was strongest among general internists and family/general practitioners, who experienced a 5.5 percentage-point increase, and medical specialists, who experienced a 3.3 percentage-point increase (see Table 2). Physicians in group/staff model HMOs saw the largest growth in quality-based compensation arrangements. In contrast, there was no significant growth among physicians who practice in small groups with fewer than 10 physicians.
Back to Top
Table 1
|
|||||||
|
|
Quality is a Compensation Factor
|
Quality is a Very Important Compensation Factor
|
|||||
| All Physicians |
20.2%
|
9.1%
|
|||||
| Specialty | |||||||
| Primary Care Physicians (R) |
27.9
|
12.3
|
|||||
| Internal Medicine, Family or General Practice |
30.4
|
13.2
|
|||||
| Pediatricians |
20.7*
|
9.7
|
|||||
| Medical Specialists |
17.8*
|
8.7*
|
|||||
| Surgical Specialists |
12.6*
|
4.9*
|
|||||
| Practice Capitation | |||||||
| Low Capitation (<5% of practice revenue) (R) |
13.5
|
6.9
|
|||||
| Moderate Capitation (5-20% of practice revenue) |
20.3*
|
7.5
|
|||||
| High Capitation (>20% of practice revenue) |
33.4*
|
14.2*
|
|||||
| Practice Type | |||||||
| Small Group (<10 physicians) (R) |
11.1
|
4.8
|
|||||
| Medium Group (10-29 physicians) |
12.8
|
8.3
|
|||||
| Large Group (30+ physicians) |
25.9*
|
9.6*
|
|||||
| Group/Staff HMO |
64.3*
|
26.4*
|
|||||
| Hospital, Medical School and Other Settings |
21.1*
|
9.7*
|
|||||
| * Difference from reference group, as indicated
by (R), is statistically significant at p<.05. Note: Sample excludes full owners of solo practices. Source: Community Tracking Study Physician Survey |
|||||||
Click here to view this table as a PowerPoint slide.
Table 2
|
||||||||
|
1996-97
|
1998-99
|
2000-01
|
2004-05
|
|||||
| Specialty | ||||||||
| Primary Care Physician |
25.6%
|
26.6%
|
24.0%*
|
27.9%*
|
||||
| Internal Medicine, Family or General Practice |
26.3
|
26.7
|
24.9
|
30.4*
|
||||
| Pediatricians |
24.1
|
26.0
|
21.1*
|
20.7
|
||||
| Medical Specialists |
15.5
|
16.1
|
14.5
|
17.8*
|
||||
| Surgical Specialists |
12.5
|
12.6
|
11.6
|
12.6
|
||||
| Practice Type | ||||||||
| Small Group (<10 physicians) |
11.6
|
11.8
|
11.7
|
11.1
|
||||
| Medium Group (10-29 physicians) |
11.8
|
8.6*
|
9.8
|
12.8
|
||||
| Large Group (30+ physicians) |
23.0
|
19.7
|
19.9
|
25.9
|
||||
| Group/Staff HMO |
48.3
|
53.1
|
53.4
|
64.3*#
|
||||
| Hospital, Medical School and Other Settings |
21.0
|
21.6
|
19.5*
|
21.1
|
||||
| * Difference from previous survey period
is statistically significant at p<.05. * Difference between 1996-97 and 2004-05 is statistically significant at p<.05. Note: Sample excludes full owners of solo practices. Source: Community Tracking Study Physician Survey |
||||||||
Click here to view this table as a PowerPoint slide.
Rise in Quality-Based Incentives
![]() he percentage of physicians with quality-based compensation
incentives in 2004-05 was not significantly different from that in 1996-97.
The recent increase in quality-based compensation largely reversed a significant
decline between 1998-99 and 2000-01, which most likely was associated with the
sharp drop in capitation during this period. The percentage of physicians in
practices that had capitated contracts with health plans dropped from 62 percent
to 50 percent between 1998-99 and 2000-01 (see Table 3).
The use of capitated contracts has remained steady since 2000-01, so increased
capitation cannot explain the rise in the use of quality measures. Despite this,
the greatest growth in quality-based compensation was seen among physicians
in practices that receive a substantial portion of their revenue from capitation—greater
than 20 percent of total revenue.
he percentage of physicians with quality-based compensation
incentives in 2004-05 was not significantly different from that in 1996-97.
The recent increase in quality-based compensation largely reversed a significant
decline between 1998-99 and 2000-01, which most likely was associated with the
sharp drop in capitation during this period. The percentage of physicians in
practices that had capitated contracts with health plans dropped from 62 percent
to 50 percent between 1998-99 and 2000-01 (see Table 3).
The use of capitated contracts has remained steady since 2000-01, so increased
capitation cannot explain the rise in the use of quality measures. Despite this,
the greatest growth in quality-based compensation was seen among physicians
in practices that receive a substantial portion of their revenue from capitation—greater
than 20 percent of total revenue.
Another factor relevant to growing use of quality-based compensation is the trend of physicians moving to practice settings that are more likely to use this tool. Between 2000-01 and 2004-05, the percentage of physicians practicing in groups with 10 or more physicians rose from 14.7 percent to 19.4 percent. Moreover, the number of solo, self-employed practitioners has declined steadily for years, from 30.3 percent of patient-care physicians in 1996-97 to 23.1 percent in 2004-05.
By breaking down the growth in the use of quality measures in physician compensation between 2000-01 and 2004-05 into components associated with the movement of physicians to different practice settings and other factors, at least 30 percent, or 0.8 of a percentage point, of the 2.6 percentage-point increase in the proportion of physicians reporting compensation tied to quality measures was attributable to the movement of physicians to practice settings where such incentives are more prevalent.
Back to Top
Table 3
|
||||||||
|
1996-97
|
1998-99
|
2000-01
|
2004-05
|
|||||
| Specialty | ||||||||
| Primary Care Physician |
39.5%
|
38.6%
|
39.1%
|
36.1%*#
|
||||
| Internal Medicine, Family or General Practice |
30.3
|
29.2
|
30.7*
|
26.9*#
|
||||
| Pediatricians |
9.3
|
9.4
|
8.4*
|
9.2
|
||||
| Medical Specialists |
33.6
|
36.4*
|
37.7
|
39.5#
|
||||
| Surgical Specialists |
26.9
|
25.0*
|
23.2*
|
24.4#
|
||||
| Practice Type | ||||||||
| Small Group (<10 physicians) |
34.4
|
31.4*
|
35.2*
|
29.5*#
|
||||
| Medium Group (10-29 physicians) |
7.9
|
8.3
|
9.0
|
10.6#
|
||||
| Large Group (30+ physicians) |
6.6
|
7.7*
|
5.7*
|
8.8*#
|
||||
| Group/Staff HMO |
7.1
|
6.3*
|
5.0*
|
5.9
|
||||
| Hospital, Medical School and Other Settings |
40.9
|
46.3*
|
45.1
|
45.2#
|
||||
| Practice Revenue from Capitation | ||||||||
| Any Capitation |
61.1
|
62.2
|
50.1*
|
48.3#
|
||||
| Mean % Capitated Revenue, Given Any |
30.8
|
32.0*
|
30.0*
|
31.1
|
||||
| * Difference from previous survey period
is statistically significant at p<.05. # Difference between 1996-97 and 2004-05 is statistically significant at p<.05. Note: Sample excludes full owners of solo practices. Source: Community Tracking Study Physician Survey |
||||||||
Back to Top
Implications
![]() lthough the United States spends more per capita on health
care than any other nation, numerous reports highlight deficiencies in the quality
of care.5 Pay for performance is one approach under consideration
as a way to garner greater value from the more than $1.9 trillion spent annually
on U.S. health care. A number of health plans and other private payers have
initiated P4P programs, and the Centers for Medicare and Medicaid Services (CMS)
has several demonstration projects underway to investigate whether P4P can be
incorporated into Medicare. Congress in December 2006 passed Medicare legislation
to pay a 1.5 percent bonus to physicians who report on quality measures in 2007.
lthough the United States spends more per capita on health
care than any other nation, numerous reports highlight deficiencies in the quality
of care.5 Pay for performance is one approach under consideration
as a way to garner greater value from the more than $1.9 trillion spent annually
on U.S. health care. A number of health plans and other private payers have
initiated P4P programs, and the Centers for Medicare and Medicaid Services (CMS)
has several demonstration projects underway to investigate whether P4P can be
incorporated into Medicare. Congress in December 2006 passed Medicare legislation
to pay a 1.5 percent bonus to physicians who report on quality measures in 2007.
Although P4P is often thought of as a new innovation, roughly one in five physicians outside of solo practice is already compensated on the basis of their quality of care, a percentage that has changed little over the past decade. Moreover, nearly one in 10 physicians reported that quality incentives are a very important component of their compensation. These incentives are at least partially a reflection of financial incentives physician practices currently receive from public and private payers.
If public and private payers seek to significantly expand quality-based physician compensation through P4P or quality reporting, it is important to understand why the past use of quality measures in physician compensation has been both uneven and relatively uncommon. One likely factor is the lack of a broad and consistent range of important clinical care process and outcome measures that physicians accept as valid. So far, the number of acceptable measures is relatively small and drawn mostly from primary care. Expanding quality-based compensation to many medical and surgical specialties will require developing measures relevant to the conditions those physicians treat and determining accurate methods to attribute which physician is responsible for providing what care to individual patients.
Quality-based compensation also may be limited by the fact that a majority of physicians practice in solo and small group settings where they typically treat relatively small numbers of patients with conditions covered by any particular payer’s quality/performance measures. The “small number” problem makes it difficult to apply quality/performance measures with the statistical reliability crucial to their acceptability. Using common measures and sharing data across public and private payers may be one way to address this limitation.
If there are natural limits to the use of quality-based physician compensation, then policy makers should consider developing additional policies to complement P4P programs’ efforts to improve the quality of care, such as development and promotion of more clinical guidelines, subsidies for adoption of electronic medical records and disease management programs. In the meantime, physicians will continue to be compensated primarily on the basis of their productivity, an incentive that has uncertain implications for quality of care but which likely increases the cost of care by encouraging the provision of more services to patients.6
Back to Top
Notes
Back to Top
Data Source
This Issue Brief presents findings from the HSC Community Tracking Study Physician Survey, a nationally representative telephone survey of physicians involved in direct patient care in the continental United States conducted in 1996-97, 1998-99, 2000-01 and 2004-05. The sample of physicians was drawn from the American Medical Association and the American Osteopathic Association master files and included active, nonfederal, office- and hospital-based physicians who spent at least 20 hours a week in direct patient care. Residents and fellows were excluded. The 1996-97, 1998-99 and 2000-01 surveys each contain information on about 12,000 physicians, while the 2004-05 survey includes responses from more than 6,600 physicians. The response rates ranged from 52 percent to 65 percent. Physicians who were not full owners of solo practices were asked about factors that affected their compensation, as well as the relative importance of each incentive to the physicians’ compensation. More detailed information on survey content and methodology can be found at www.hschange.org.
Back to Top
ISSUE BRIEFS are published by the
Center for Studying Health System Change.
600 Maryland Avenue, SW, Suite 550
Washington, DC 20024-2512
Tel: (202) 484-5261
Fax: (202) 484-9258
www.hschange.org