
No Exodus: Physicians and Managed Care Networks
Tracking Report No. 14
May 2006
Ann S. O'Malley, James D. Reschovsky
After remaining stable since 1996-97, the percentage of U.S. physicians who do not contract with managed care plans rose from 9.2 percent in 2000-01 to 11.5 percent in 2004-05, according to a national study from the Center for Studying Health System Change (HSC). While physicians have not left managed care networks in large numbers, this small but statistically significant increase could signal a trend toward greater out-of-pocket costs for patients and a decline in patient access to physicians. The increase in physicians without managed care contracts was broad-based across specialties and other physician and practice characteristics. Compared with physicians who have one or more managed care contracts, physicians without managed care contracts are more likely to have practiced for more than 20 years, work part time, lack board certification, practice solo or in two-physician groups, and live in the western United States. The study also found substantial variation in the proportion of physicians without managed care contracts across communities, suggesting that local market conditions influence decisions to contract with managed care plans.
- Despite Physician Complaints, Most Still Contract with Managed Care Plans
- Many Factors Influence Decisions
- Who Doesn’t Contract
- Market Variation
- Implications
- Notes
- Data Source
Despite Physician Complaints, Most Still Contract with Managed Care Plans
![]() necdotal stories in the news media abound about physicians
dropping out of health insurance networks or closing their practices to new
managed care patients. The perception that physicians were dropping out of insurance
networks at “alarming rates” prompted a 2004 congressional hearing.1
Reports suggest physicians are frustrated by costly and time-consuming administrative
burdens and low payment rates associated with health insurance contracts, including
health maintenance organizations (HMOs), preferred provider organizations (PPOs)
and other managed care arrangements.2
necdotal stories in the news media abound about physicians
dropping out of health insurance networks or closing their practices to new
managed care patients. The perception that physicians were dropping out of insurance
networks at “alarming rates” prompted a 2004 congressional hearing.1
Reports suggest physicians are frustrated by costly and time-consuming administrative
burdens and low payment rates associated with health insurance contracts, including
health maintenance organizations (HMOs), preferred provider organizations (PPOs)
and other managed care arrangements.2
While the overwhelming majority of physicians continue to contract with insurers, the proportion of physicians nationally without a managed care contract increased from 9.2 percent to 11.5 between 2000-01 and 2004-05, according to HSC’s Community Tracking Study Physician Survey (see Table 1 and Data Source). During the same period, the number of practicing U.S. physicians grew from 379,000 to 397,000, resulting in an estimated 45,600 physicians in 2004-05 without any managed care contracts, up from an estimated 35,000 in 2000-01.
The increase among physicians without a managed care contract was consistent with increases in the percentage of physicians reporting their practice does not receive any managed care revenue. Among physicians who had at least one managed care contract, the average number of contracts remained stable at 13, as did the average proportion of practice revenue from managed care contracts (44%).
Options for physicians who do not contract with managed care plans range from seeing only patients covered by insurance products that do not include provider networks (including fee-for-service Medicare), establishing cash-only practices, and serving managed care patients as an out-of-network provider who can balance bill patients for charges beyond insurer reimbursements for out-of-network providers. In this last arrangement, physicians might continue to file claims with managed care plans or place the responsibility for dealing with insurers on patients. So-called “concierge” or “boutique” practices often fall into one of these categories, along with requiring patients to pay a sizable retainer in exchange for enhanced access.
Table 1
|
|
1996-97
|
1998-99
|
2000-01
|
2004-05
|
|
| Physicians with No Managed Care Contracts |
9.4%
|
8.6%
|
9.2%
|
11.5%*
|
| Average Number of Managed Care Contracts Among Physicians with > 1 Managed Care Contract |
12
|
13
|
13
|
13
|
| Physicians with No Managed Care Revenue |
5.7%
|
5.2%
|
5.8%
|
8.6%*
|
| Revenue from Managed Care Among Physicians with > 1% Managed Care Revenue (mean) |
42%
|
45%
|
45%
|
44%
|
| * Change from 2000-01 is statistically significant at p <.001. Source: Community Tracking Study Physician Survey |
||||
Back to Top
Many Factors Influence Decisions
![]() lthough physicians can decide not to contract with managed care plans, sometimes managed care plans decline to contract with specific physicians, either because they lack credentials, such as board certification in their specialty, or because the physician is believed to have costly practice patterns or provide substandard care.
lthough physicians can decide not to contract with managed care plans, sometimes managed care plans decline to contract with specific physicians, either because they lack credentials, such as board certification in their specialty, or because the physician is believed to have costly practice patterns or provide substandard care.
Likely reasons physicians may choose not to contract with managed care plans include patient demand for their services, plan payment rates, clinical autonomy and administrative burdens associated with managed care contracts. These considerations also likely enter into decisions about which plans to contract with. As such, individual physicians are likely to make different decisions about contracting depending on their reputation, how much they need to compete for patients, their preferences for income or clinical autonomy, and how able and willing their patients are to pay higher out-of-network fees, among other factors. By the same token, patients enrolled in managed care plans see out-of-network physicians for many reasons, including the belief that the out-of-network physician provides higher quality of care, travel distance and a desire to maintain continuity of care with a specific physician after a plan or network switch.3
Growth in the percentage of physicians without a managed care contract may reflect shrinking numbers of privately insured patients who are covered by HMO plans that do not pay for care received from out-of-network providers. At the same time, enrollment in plans that pay some cost of out-of-network care—PPO and point of service (POS) plans—grew 13 percentage points between 2000 and 2005 at the expense of both HMO plans and indemnity insurance. In 2005, more than three-quarters of people with employer health coverage were enrolled in a PPO or POS plan.4
Back to Top
Who Doesn’t Contract
![]() he increase in the percentage of physicians without a managed
care contract occurred across a broad range of physician and practice characteristics.
Examining the characteristics of physicians without managed care contracts provides
some clues about the underlying reasons they may not contract with health plans
(see Table 2).
he increase in the percentage of physicians without a managed
care contract occurred across a broad range of physician and practice characteristics.
Examining the characteristics of physicians without managed care contracts provides
some clues about the underlying reasons they may not contract with health plans
(see Table 2).
For instance, physicians who are not board certified in their specialty—only 11 percent of all physicians—are half as likely to contract with managed care compared with board-certified physicians, suggesting that not meeting health plan credentialing requirements is a factor. Among physicians with managed care contracts, 8 percent lack certification, while among physicians with no managed care contracts, 16 percent lack certification.
Physicians in solo or two-physician practices are less likely to contract with managed care plans, perhaps reflecting their higher costs and difficulties in handling administrative burdens. Larger group practices and institutional-based practices (i.e. medical schools or hospitals) more likely can invest in the administrative infrastructure needed to deal with health plan claims processing and clinical oversight. Solo/two-physician practices may not be able to negotiate higher payment rates with health plans, as many larger practices do.
Physicians in practice for more than 20 years are less likely to contract with managed care plans than those in practice for 10 years or less, suggesting that older, experienced physicians may have developed the patient base and reputation that better allows them to practice without managed care contracts. It is also likely that some older physicians are phasing out their practices by keeping only patients with whom they’ve had long-term relationships and possibly those patients willing to bear higher out-of-pocket costs. Indeed, 23 percent of physicians in solo/two physician practices who are older than 60—7 percent of all physicians—do not contract with managed care.
The increase in the percentage of physicians without a managed care contract also occurred across most physician specialties. Generally the increase was small, with one exception: obstetrician-gynecologists. In this specialty, the percentage with no managed care contracts tripled to 11.8 percent in 2004-05, after remaining stable since 1996-97 at about 3.5 percent. In previous years, the percentage of obstetrician-gynecologists with no managed care contracts was much lower than for other specialties, but their contracting rate is now similar to their colleagues.
Psychiatry has long been a specialty with the largest proportion of physicians without managed care contracts. In 2004-05, 35 percent of psychiatrists did not contract with managed care. This likely reflects both low reimbursements and the greater utilization management from health plans and managed behavioral health companies that many psychiatrists face. It also may reflect shortages of psychiatrists in many areas.
Back to Top
Table 2
|
|
PHYSICIAN CHARACTERISTICS
|
|
| Gender | |
| Female (R) |
11.4%
|
| Male |
11.5
|
| Race | |
| White (R) |
11.1
|
| Black |
11.6
|
| Other |
9.0
|
| Hours Worked in Previous Week | |
| Part Time (1-39 hours) (R) |
15.3
|
| Full Time (40 hours) |
9.8**
|
| Years in Practice | |
| 0-10 Years (R) |
10.6
|
| 11-20 Years |
9.6
|
| 21+ Years |
14.3**
|
| Specialty | |
| Primary Care Physicians (R) |
9.4
|
| Medical Specialists |
10.5
|
| Surgical Specialists |
8.8
|
| OB-GYN |
11.8
|
| Psychiatrists |
34.6**
|
| Board Certification | |
| Board Certified (R) |
10.7
|
| Not Board Certified |
19.6**
|
| PRACTICE CHARACTERISTICS | |
| Practice Size | |
| Solo/2 Physicians (R) |
15.2
|
| 3 or More Physicians |
7.4**
|
| Institutional Practice |
11.7**
|
| Census Region | |
| West (R) |
14.8
|
| Northeast |
10.5*
|
| South |
11.5*
|
| Midwest |
8.6**
|
| MARKET CHARACTERISTICS | |
| Competitive Situation Practice Faces1 | |
| Not at all Competitive (R) |
15.6
|
| Somewhat Competitive |
8.6**
|
| Very Competitive |
10.1**
|
| Private Insurer PPO Payment Levels | |
| Lowest Third (R) |
11.7
|
| Middle Third |
11.6
|
| Highest Third |
9.5**
|
|
Difference from reference group, as indicated by (R), is statistically significant at * p<.05 and ** p<.01. 1. Physician respondents were asked to describe the competitive situation
that their practice faced from other physicians. |
|
Market Variation
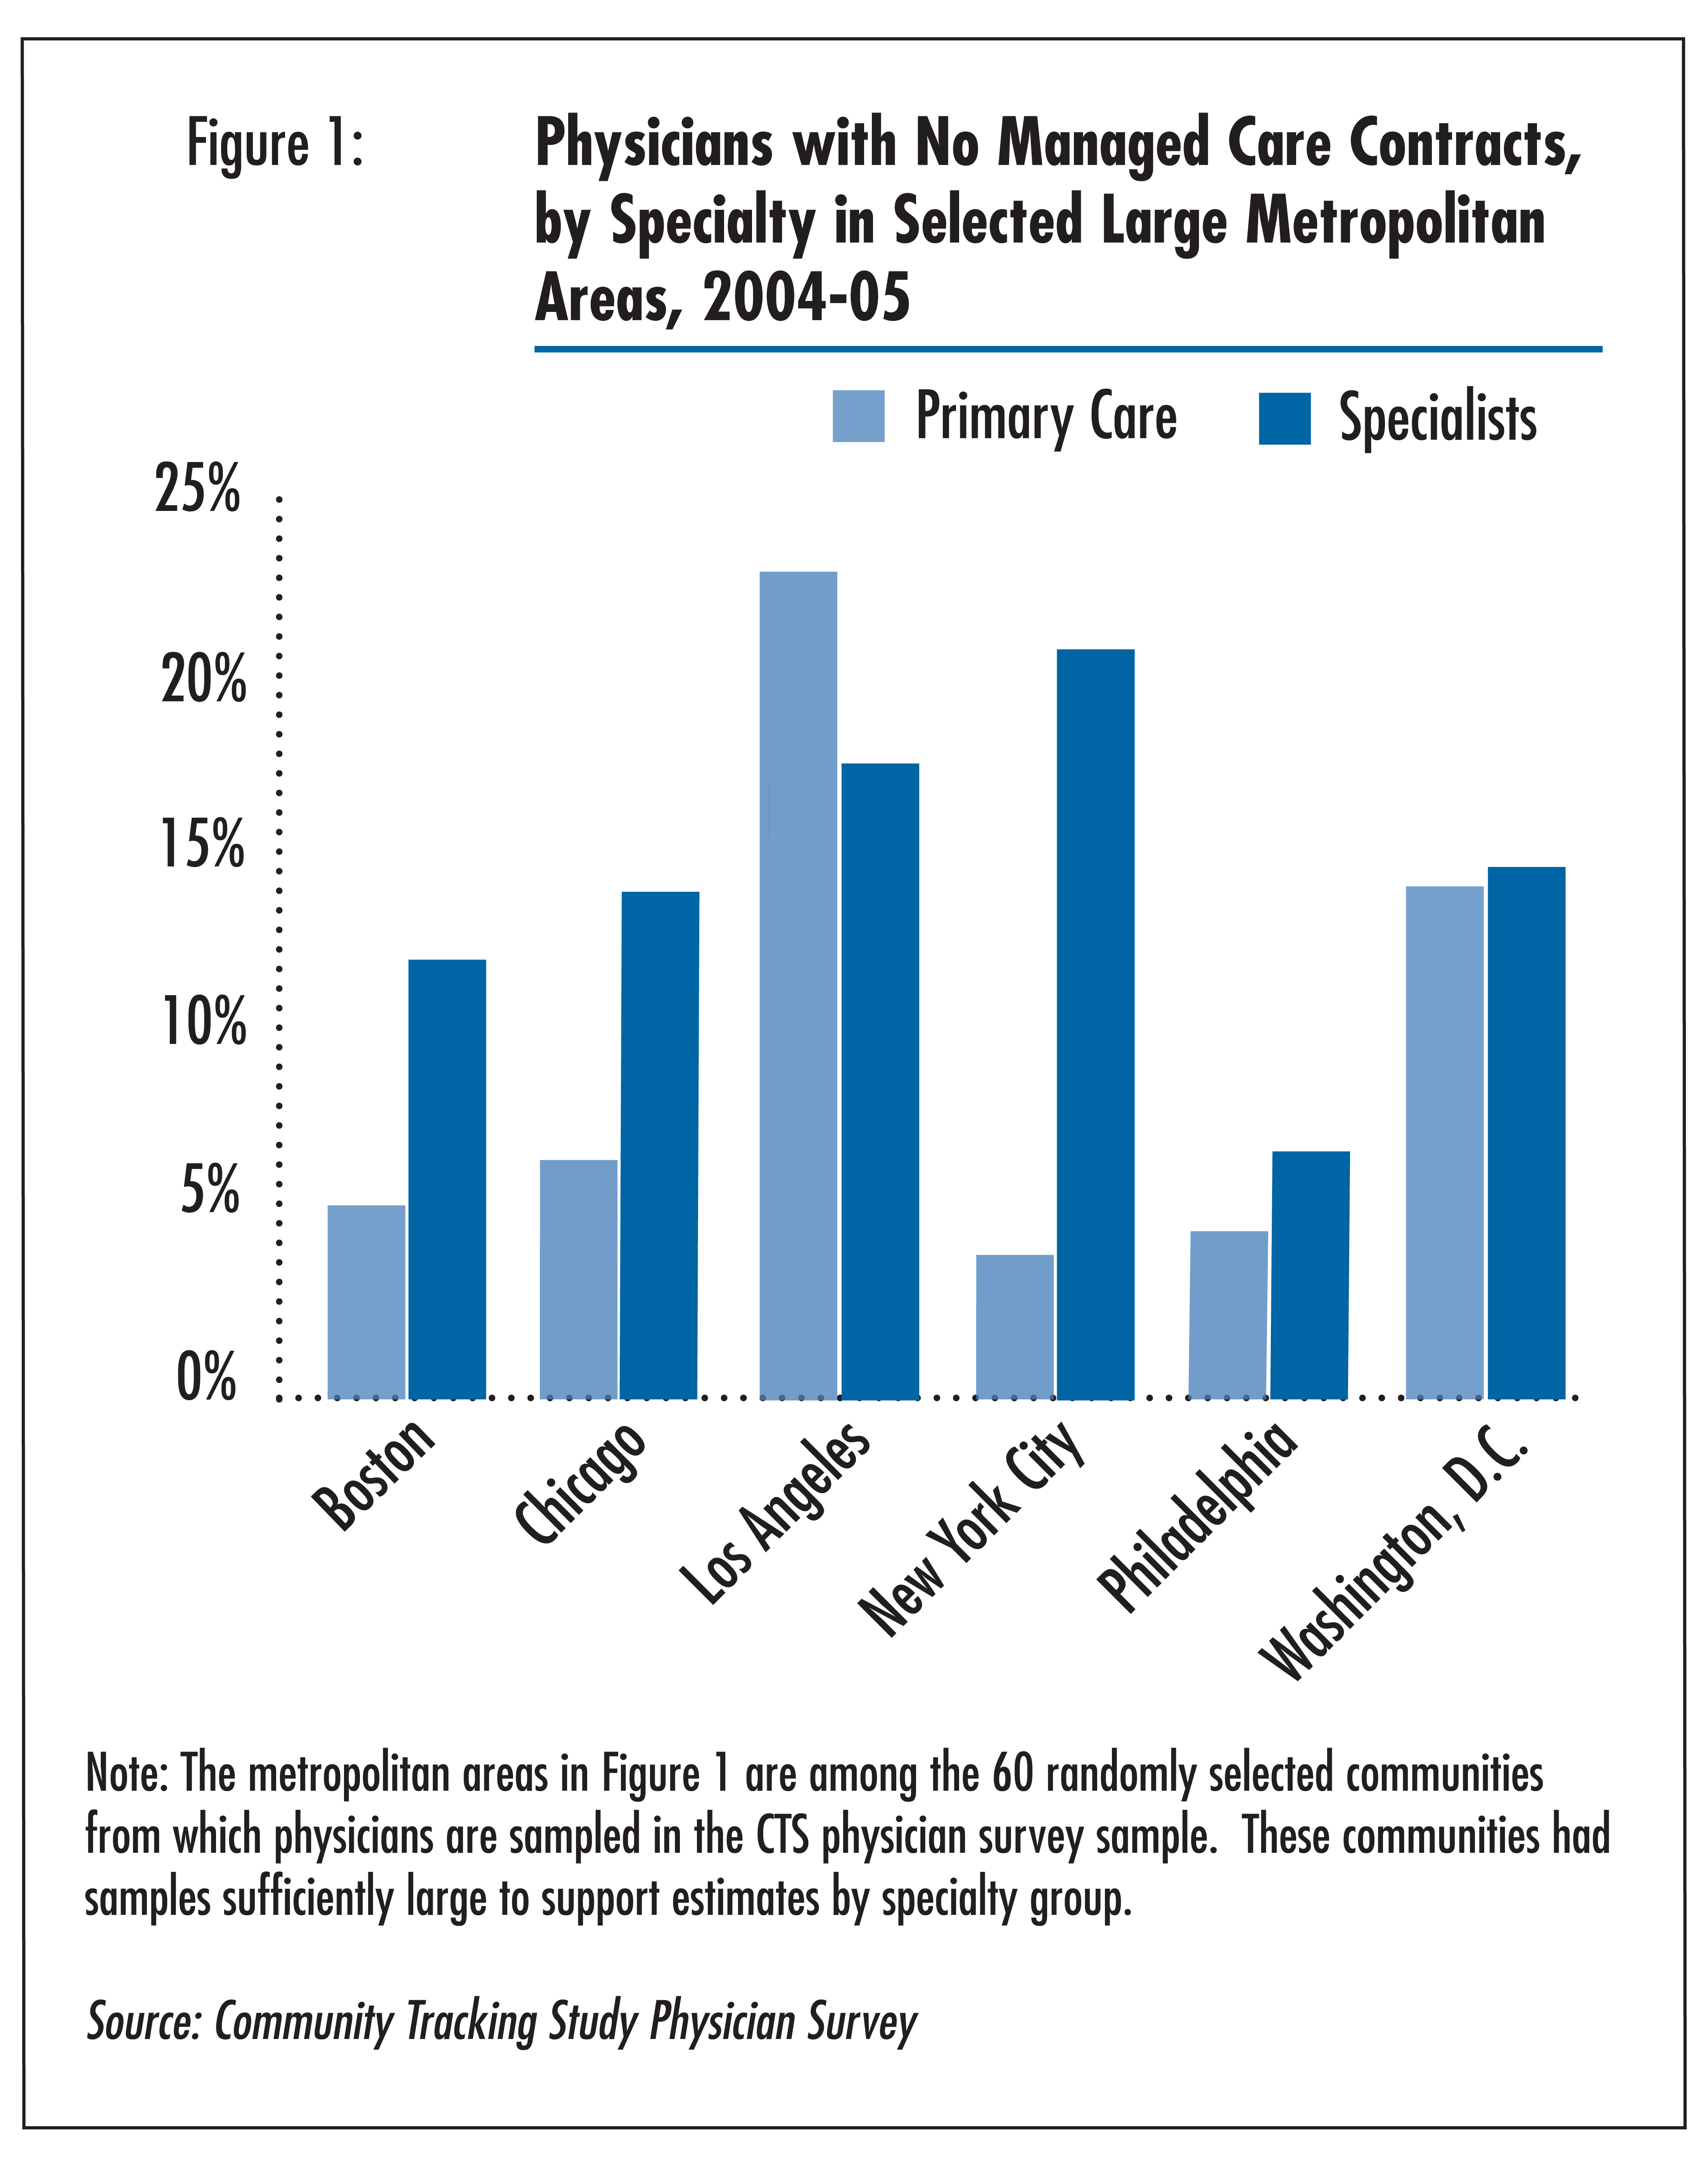
![]() here was substantial variation in the percentage of physicians
without managed care contracts across communities, suggesting that local market
conditions influence physician decisions to contract with managed care plans
(see Figure 1). Moreover, the patterns for primary care
physicians often differ from those of specialists in the same community.
here was substantial variation in the percentage of physicians
without managed care contracts across communities, suggesting that local market
conditions influence physician decisions to contract with managed care plans
(see Figure 1). Moreover, the patterns for primary care
physicians often differ from those of specialists in the same community.
Other market conditions also appear to be relevant to physician contracting decisions. For instance, physicians are less likely to contract with managed care in communities where private health plan payment rates are low relative to communities with higher payments.5 Moreover, physicians who reported they did not face much competition for patients were more likely to not contract with managed care than those who indicated they faced a very or somewhat competitive situation. On the other hand, contracting rates differed little across communities with low vs. high HMO enrollment. Based on supplemental analyses not shown, primary care physicians appeared to be less sensitive to market conditions in their decisions to contract than specialists.
Back to Top
Implications
![]() hile it is far from an exodus, the percentage of physicians
without a managed care contract ticked up to 11.5 percent in 2004-05, after
remaining stable at about 9 percent since 1996-97. At present, it is unclear
whether this small but significant increase in the percentage of physicians
without managed care contracts is the beginning of a more pervasive trend. Either
way, the increase likely reflects market trends toward enrollment in plans that
allow for out-of-network care, such as PPOs, and increasing frustration among
physicians with the administrative burdens and low reimbursement rates of health
plans.6
hile it is far from an exodus, the percentage of physicians
without a managed care contract ticked up to 11.5 percent in 2004-05, after
remaining stable at about 9 percent since 1996-97. At present, it is unclear
whether this small but significant increase in the percentage of physicians
without managed care contracts is the beginning of a more pervasive trend. Either
way, the increase likely reflects market trends toward enrollment in plans that
allow for out-of-network care, such as PPOs, and increasing frustration among
physicians with the administrative burdens and low reimbursement rates of health
plans.6
Patients who use out-of-network physicians will usually bear higher out-of-pocket costs and extra billing paperwork. Under physicians’ balanced-billing practices, patients seeing non-network providers are responsible for paying the difference between the “usual and customary” allowable fee paid by their insurer and the actual fee charged by the physician. While patients willing to pay more to see out-of-network physicians may experience better access and more time during the patient-physician encounter without the intrusion of third parties, these benefits could be offset by reduced access to physician care among the remainder of the population. For patients who are high users of health care services, use of out-of-network providers could result in high out-of-pocket spending burdens, depending on their plan’s out-of-pocket maximum.
While very few of the physicians who choose to stop contracting are establishing concierge practices, the rise in non-concierge physicians who do not participate in managed care contracts may result in increasing numbers of patients who find that they can no longer afford to see their long-term physicians. Together, these trends appear symptomatic of the widening rift in the health care system between the economically secure and the rest of American society.7
Back to Top
Notes
| 1. | The Joint Economic Committee of Congress, congressional hearing titled “Consumer-Directed Doctoring: The Doctor is in, Even if Insurance is Out” (April 28, 2004), http://jec.senate.gov/_files/95063.PDF; “COD=Cash-Only Doctors,” Associated Press (April 5, 2004), http://www.cbsnews.com/stories/2004/04/05/health/printable610269.shtml; “Doctors Launch Cash-Only Practices: Under New System, Physicians are ‘Charging Less and Making More,’” Anne Thompson, NBC News (May 19, 2004), http://www.msnbc.msn.com/id/5014568/print/1/displaymode/1098/; “Doctors in State Fleeing HMOs: Consumer Advocates Alarmed by Trend,” Sabin Russell, San Francisco Chronicle (Feb. 9, 2003), http://sfgate.com/cgi-bin/article.cgi?f=/c/a/2003/02/09/MN133699.DTL&hw=Doctors+in+State+fleeing+HMOs&sn=001&sc=1000. |
| 2. | Managed care was defined for the physician respondent as “including
HMOs, PPOs, independent practice associations (IPAs) and other types of
group health plans using financial incentives or specific controls to encourage
utilization of specific providers associated with the plan. Direct contracts
with employers that use these mechanisms are also considered managed care.” |
| 3. | Rand Corp., “Inside the Black Box of Managed Care Decisions: Understanding Patient Disputes over Coverage Denials” Research Brief No. 9039, (2004), http://www.rand.org/pubs/research_briefs/RB9039/index1.html. |
| 4. | Gabel, Jon, et al., “Health Benefits in 2005: Premium Increases Slow to a Single Digit but Coverage Continues to Erode,” Health Affairs, Vol. 24, No.5 (September/October 2005). |
| 5. | Based on an index reported in U.S. Government Accountability Office, Federal
Employees Health Benefits Program, Competition and Other Factors Linked
to Wide Variation in Health Care Prices, Report No. GAO-05-856 (August
2005). |
| 6. | Kesselheim, Aaron S., and Troyen A. Brennan, “Overbilling vs. Downcoding—The
Battle between Physicians and Insurers,” New England Journal of
Medicine, Vol. 352, No. 9 (March 2005); Medicare Payment Advisory Commission,
“Report to the Congress, Medicare Payment Policy,” Washington,
D.C. (March 2005). |
| 7. | Hurley, Robert, Hoangmai H. Pham and Gary Claxton, “A Widening Rift In Access And Quality: Growing Evidence of Economic Disparities,” Health Affairs Web exclusive (Dec. 6, 2005). |
Back to Top
Data Source
This Tracking Report presents findings from the HSC Community Tracking Study
Physician Survey, a nationally representative telephone survey of physicians
involved in direct patient care in the continental United States conducted in
1996-97, 1998-98, 2000-01 and 2004-2005. The sample of physicians was drawn
from the American Medical Association and the American Osteopathic Association
master files and included active, nonfederal, office- and hospital-based physicians
who spent at least 20 hours a week in direct patient care. Residents and fellows,
as well as radiologists, anesthesiologists and pathologists were excluded. The
1996-97, 1998-99 and 2000-01 surveys each contain information on about 12,000
physicians, while the 2004-05 survey includes responses from more than 6,600
physicians. The response rates ranged from 52 percent to 65 percent.
Back to Top
ISSUE BRIEFS are published by the
Center for Studying Health System Change.
600 Maryland Avenue, SW, Suite 550
Washington, DC 20024-2512
Tel: (202) 484-5261
Fax: (202) 484-9258
www.hschange.org
Vice President: Jon Gabel