
Perception, Reality and Health Insurance: Uninsured as Likely as Insured to Perceive Need for Care but Half as Likely to Get Care
Issue Brief No. 100
October 2005
Jack Hadley, Peter J. Cunningham
While considerable research shows that uninsured people are less likely to seek and receive medical care, some contend that the uninsured are uninsured by choice and can obtain care when needed. A new study by the Center for Studying Health System Change (HSC), however, undercuts the validity of this contention, finding that there is no difference between insured and uninsured people’s perception of the need to see a medical provider when they experience a serious new symptom. However, among people who believed that they needed medical care, the uninsured were less than half as likely to see or talk to a doctor, indicating that lack of insurance is a major barrier to uninsured people getting needed medical care.
- Uninsured by Choice?
- Symptom Severity Drives Perception of Need
- Implications
- Notes
- Data Source
- Supplementary Table
Uninsured by Choice?
![]() esearch has shown that early detection and treatment of
medical problems can lead to better clinical outcomes and improved health.1
While considerable research indicates that health insurance encourages people
to seek timely care,2 some contend that the uninsured are
uninsured by choice and can obtain care when needed.3 Although
this contention has several dimensions, two key elements include:
esearch has shown that early detection and treatment of
medical problems can lead to better clinical outcomes and improved health.1
While considerable research indicates that health insurance encourages people
to seek timely care,2 some contend that the uninsured are
uninsured by choice and can obtain care when needed.3 Although
this contention has several dimensions, two key elements include:
- The uninsured are less likely to perceive a need for care, either because they are healthier or, if they do become sick, they have different attitudes or preferences that make them less likely to seek care.
- When the uninsured do get sick and need care, they are able to get care from safety net providers or by paying out of pocket.
HSC’s 2003 nationally representative Household Survey asked people 18 and older whether they had recently experienced a new occurrence of any of 15 symptoms—such as shortness of breath, chest pain, persistent headache or loss of consciousness—identified by a physician panel as either potentially life threatening or having a significant impact on quality of life if not treated4 (see Data Source and Table 1 for a complete list of symptoms).
The survey found that the uninsured were significantly more likely—23.2 percent of the uninsured compared with 18.9 percent of the insured—to report the recent onset of at least one of these symptoms.
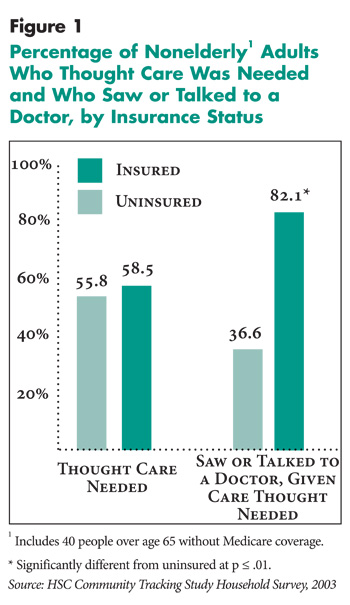
Among those with a new symptom, there was no difference between insured and uninsured people’s perception of the need to see a medical provider when they experienced any of the 15 new symptoms or conditions (see Figure 1 and Table 2). Overall, about 58 percent of the people with a new symptom or condition believed that they needed to see or talk to a medical provider. However, even with similar conditions and similar severity levels, uninsured people were much less likely than the insured to obtain medical care in response to the new symptom. Among those who believed that they needed to seek care, 82 percent of the insured saw or talked to a medical provider, compared with 37 percent of the uninsured.
Differences in perceived need for care also are sometimes used to explain differences in access and use of services among whites and minorities; higher-income and lower-income people; and people with limited education. However, the findings show that there are minimal differences in the perceived need for care for these 15 symptoms by race/ethnicity, income or education. Racial and ethnic minorities, lower-income people, and people with less-than-college education have the same perceptions of when care is needed as whites, higher-income people, and people with college educations.
Back to Top
Table 1
|
||
|
Insured
|
Uninsured
|
|
| Serious Symptoms | ||
| Back or Neck Pain |
9.6%
|
11.0%
|
| Shortness of Breath |
7.9
|
9.4
|
| Loss of Consciousness |
3.0
|
2.7
|
| Unusually Blurry Vision |
5.4
|
7.3
|
| Frequent or Severe Headaches |
14.0#
|
18.8
|
| Lump or Mass in Breast |
1.5#
|
0.6
|
| Chest Pain for More Than 1 Minute |
4.6
|
5.8
|
| Morbid Symptoms | ||
| Cough with Yellow Sputum |
13.5*
|
5.9
|
| Sadness, Hopelessness, Frequent Crying |
10.7
|
11.5
|
| Anxiety, Nervousness |
3.1
|
4.1
|
| Pain in Hip or Knee |
10.5*
|
4.0
|
| Sprained Ankle |
3.8
|
3.9
|
| Fatigue or Extreme Tiredness |
9.5
|
11.6
|
| Difficulty Urinating (males only) |
0.1
|
0.8
|
| Difficulty Hearing |
2.9
|
2.8
|
| Note: Column percentages sum to 100. * Significantly different from uninsured at p <.01. # Significantly different from uninsured at p <.05. Source: Community Tracking Study Household Survey, 2003 |
||
Back to Top
 |
Back to Top
Table 2
|
||
|
Thought Care Needed
|
Saw or Talked to a Doctor, Given Care Thought Needed
|
|
| All Nonelderly Adults |
57.9%
|
72.5%
|
| Insurance Coverage | ||
| Uninsured (R) |
55.8
|
36.6
|
| Insured |
58.5
|
82.1*
|
| Usual Source of Care | ||
| No Usual Source of Care (R) |
49.7
|
47.4
|
| Usual Source, No Regular Doctor |
56.2
|
69.4*
|
| Usual Source, Regular Doctor |
60.8#
|
79.0*
|
| Age | ||
| 18-44 (R) |
54.6
|
67.9
|
| 45 641 |
65.2#
|
78.7
|
| Gender | ||
| Male (R) |
51.4
|
67.9
|
| Female |
61.8*
|
74.8
|
| Race and Ethnicity | ||
| White, non-Hispanic (R) |
58.2
|
80.6
|
| African-American |
59.2
|
64.7#
|
| Hispanic |
60.2
|
46.3*
|
| Health Status | ||
| Excellent, Very Good (R) |
50.9
|
80.6
|
| Good |
60.9#
|
72.6
|
| Fair/Poor |
69.4*
|
58.6*
|
| Education | ||
| Less than High School (R) |
54.2
|
49.9
|
| High School Graduate |
55.4
|
70.6*
|
| College Graduate |
66.4
|
88.9*
|
| Income | ||
| Less than 200% FPL (R) |
56.3
|
55.0
|
| 200-400% FPL |
55.1
|
72.3*
|
| 400+ FPL |
61.8
|
87.8*
|
| 1 Includes 40 people over age 65 without
Medicare coverage. * Significantly different from reference group (R) a p < .01. # Significantly different from reference group (R) a p < .05. Source: Community Tracking Study Household Survey, 2003 |
||
Back to Top
Symptom Severity Drives Perception of Care Need
![]() eople’s perception that care is needed after the onset of a new symptom increases as general health status worsens and activity limitation related to the symptom increases. Overall, uninsured and insured people who reported any of the 15 new symptoms were equally likely to report experiencing an activity limitation because of the symptom. People who said that they did not need to seek care were about half as likely to say they experienced an activity limitation—27 percent vs. 57 percent of people who believed they needed care.
eople’s perception that care is needed after the onset of a new symptom increases as general health status worsens and activity limitation related to the symptom increases. Overall, uninsured and insured people who reported any of the 15 new symptoms were equally likely to report experiencing an activity limitation because of the symptom. People who said that they did not need to seek care were about half as likely to say they experienced an activity limitation—27 percent vs. 57 percent of people who believed they needed care.
Many socio-demographic factors that influence medical care use, including minority race or ethnicity, poor general health status, low education and low income, are associated with lack of insurance. But after accounting for socio-demographic differences through statistical analysis,5 the uninsured were still less than one-third as likely to actually see or talk to a doctor (see Supplementary Table 1).
Back to Top
Implications
![]() hese findings indicate that lack of health insurance—and
the resulting limits on access to care—is the main reason for differences in
the receipt of medical care between insured and uninsured people with serious
symptoms. This analysis both reinforces and extends prior research showing that
the uninsured are much less likely to receive needed medical care, even for
symptoms that can have serious health consequences if not treated.6
Finding that uninsured people are much less likely to receive needed medical
care for conditions that can have serious health consequences is consistent
with a substantial body of research that indicates the uninsured have poorer
health outcomes than the insured.7 Moreover, the findings
contradict contentions that differences in use of services between the insured
and the uninsured, between whites and racial/ethnic minorities, or between higher-
and lower-income people are a result of differences in perceptions about when
care is needed.
hese findings indicate that lack of health insurance—and
the resulting limits on access to care—is the main reason for differences in
the receipt of medical care between insured and uninsured people with serious
symptoms. This analysis both reinforces and extends prior research showing that
the uninsured are much less likely to receive needed medical care, even for
symptoms that can have serious health consequences if not treated.6
Finding that uninsured people are much less likely to receive needed medical
care for conditions that can have serious health consequences is consistent
with a substantial body of research that indicates the uninsured have poorer
health outcomes than the insured.7 Moreover, the findings
contradict contentions that differences in use of services between the insured
and the uninsured, between whites and racial/ethnic minorities, or between higher-
and lower-income people are a result of differences in perceptions about when
care is needed.
Back to Top
Notes
Back to Top
Data Source
The data used in this analysis are from a special Symptom Response Module (SRM) included in the 2003 HSC Community Tracking Study (CTS) Household Survey. The CTS is a nationally representative telephone survey supplemented by in-person interviews to include people without telephones. Approximately 47,000 people were interviewed in 2003, and the response rate was 57 percent. The SRM is based on an instrument developed by researchers for use in The Robert Wood Johnson Foundation’s National Access to Care Survey.
The SRM collected information from a subset of respondents: all uninsured adults (18 and older), all elderly people (65 and older), and a one-sixth random sample of insured, nonelderly adults (18-64 years old). (CTS sampling weights were adjusted for insured, nonelderly cases to reflect the additional random sampling.) A total of 16,266 people were screened for the SRM and 3,299 respondents (weighted 19.8%) indicated that they had experienced at least one new symptom within the last three months. This analysis is limited to 1,939 adults who did not have any Medicare coverage (1,024 uninsured and 913 insured).
The SRM asked respondents whether they had experienced a new occurrence (within the last three months) of any of 15 symptoms that were identified by a panel of physicians as either serious, i.e., potentially life threatening if not treated, or morbid, i.e., not life threatening but having a significant impact on quality of life. One serious symptom, or one morbid symptom if the person had no serious symptoms, was randomly selected for a set of follow-up questions about care-seeking behavior and activity limitations. (see Table 1 for the distribution of these symptoms). Respondents were then asked whether they had seen or talked to a doctor or other health professional about this problem. If they reported that they had not seen or talked to a doctor or other health professional, they were asked if they thought that they “. needed to contact a doctor or other health professional about this problem.” All respondents were asked whether the problem limited their ability to do any of their usual activities and, if so, for how many days they were limited in their ability to do any of their usual activities.
Back to Top
Supplementary Tables
Supplementary Table 1: Adjusted Odds Ratios: Uninsured Compared With Insured (from binomial logistic regressions)
ISSUE BRIEFS are published by the
Center for Studying Health System Change.
600 Maryland Avenue, SW, Suite 550
Washington, DC 20024-2512
Tel: (202) 484-5261
Fax: (202) 484-9258
www.hschange.org
Vice President: Jon Gabel