Tracking Health Care Costs:
A Slowing Down of the Rate of Increase
Issue Brief No. 06
January 1997
![]() hroughout the 1990s there has been a dramatic slowing of health care cost increases. Virtually all studies show a substantial decline even after adjusting for general inflation, which dropped from 4.3 percent in 1990 to 2.5 percent in 1995. The pressures to contain health care costs are so intense that the low rates of increase could continue for some time. Consumers may not perceive this change, however, perhaps because of cost-shifting to them. This Issue Brief tracks changes in health care costs over time. The Center for Studying Health System Change plans to track these changes periodically.
hroughout the 1990s there has been a dramatic slowing of health care cost increases. Virtually all studies show a substantial decline even after adjusting for general inflation, which dropped from 4.3 percent in 1990 to 2.5 percent in 1995. The pressures to contain health care costs are so intense that the low rates of increase could continue for some time. Consumers may not perceive this change, however, perhaps because of cost-shifting to them. This Issue Brief tracks changes in health care costs over time. The Center for Studying Health System Change plans to track these changes periodically.
A Lower Rate of Increase
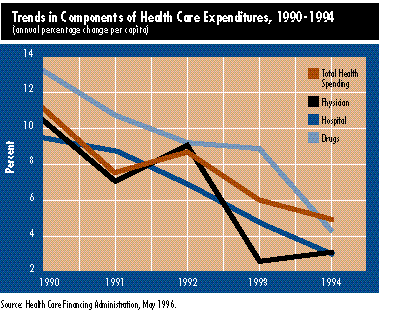
![]() ooking at a key indicator -- the national health expenditures published by the Health Care Financing Administration (HCFA) -- health care costs rose only 5.4 percent in 1994, a significant cooling-off from the high of 11.0 percent in 1990.
ooking at a key indicator -- the national health expenditures published by the Health Care Financing Administration (HCFA) -- health care costs rose only 5.4 percent in 1994, a significant cooling-off from the high of 11.0 percent in 1990.
The trend shows up even more dramatically in a series from the actuarial firm of Milliman & Robertson. Their Health Cost Index, which is based on provider survey data on the major components of health spending (hospitals, physicians, and prescription drugs), showed a 10.9 percent increase per capita in spending in 1990 and only a 3.2 percent increase in 1995.
To further illustrate how pervasive this decline in the rate of increase is, it happened in each of the three components of health spending, according to HCFA data.

Employer surveys show the steepest declines. For example, a Hay-Huggins survey of employer-sponsored health plans shows only a 1.2 percent increase in premiums per enrollee in 1995 in contrast to a whopping 11.8 percent increase in 1992.
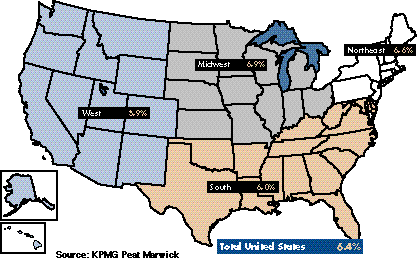
While employer surveys are consistent overall with national indicators, there are meaningful regional differences. Foremost among these, as documented by KPMG Peat Marwick data, are much lower cost increases in the West than in other regions (see map on p. 3). This may be due to the West’s more extensive and advanced systems of managed care and a higher degree of market competition than in other sections of the country, but research is needed to test this hypothesis.

Variations also are seen among industries and by firm size. KPMG Peat Marwick data also show that while premiums increased at an annual rate of 6.4 percent in all industries between 1991 and 1995, the service industry had the lowest rate of increase (5.8%) and financial firms had the highest (6.7%). Premium increases were smaller in firms with 5,000 or more employees than in firms with fewer than 1,000 employees. Between 1991 and 1995, employees in the larger firms saw their premiums increase 6.2 percent per year while those in smaller firms had an increase of 6.8 percent. These variations may reflect larger firms being more apt to be aggressive purchasers of health care services.
A Slow-Down for All Types of Health Plans
![]() erhaps the most puzzling trend is that the decline in premium growth affected fee-for-service plans almost to the same degree as managed care plans. According to the Hay-Huggins survey, the annual percentage change for premiums per enrollee by plan type between 1992 and 1995 was as follows:
erhaps the most puzzling trend is that the decline in premium growth affected fee-for-service plans almost to the same degree as managed care plans. According to the Hay-Huggins survey, the annual percentage change for premiums per enrollee by plan type between 1992 and 1995 was as follows:
- Fee-for-service: 5.0 percent
- HMO: 4.8 percent
- PPO: 5.1 percent
- Point-of-service: 3.3 percent
- All plans: 4.2 percent
Although fee-for-service plans and HMOs are only 0.2 percent apart, the difference can widen when changes in the benefit structure are taken into account. For example, a Hay-Huggins actuarial analysis performed for the Center for Studying Health System Change indicates a relatively stable benefit structure for fee-for-service plans but a slowly expanding one for HMOs. When these differences are factored in, HMOs show a lower rate of premium increase.
|
||
Explanations for the drop in premium growth in managed care plans include steeper price discounts from providers, lower hospital admission rates and lengths of stay, and other changes in practice. However, these factors are not as applicable to fee-for-service plans. In fact, there are no proven explanations as to why almost as large a drop in premium occurred in that sector, but speculation is that:
- There may have been a spillover in the more cost-effective practice patterns from managed care to fee-for-service -- for example, when physicians who change their practice patterns in response to disease management protocols implement the changes for all patients.
- Managed care techniques, such as preadmission certification, length-of-stay review, and high-cost case management, are increasingly common elements of traditional plans.
- Medicare payment rates to hospitals and doctors have increased more rapidly than costs in recent years, so providers may have slowed their increases in charges to private patients -- a reverse cost shift.
Consumers Don’t Get It
![]() ith so many indicators showing that health care cost increases are slowing down, it might come as a surprise to health policy makers to learn that consumers do not see the same picture. They consistently report that their costs are rising and have mostly negative things to say about anything related to health care costs.
ith so many indicators showing that health care cost increases are slowing down, it might come as a surprise to health policy makers to learn that consumers do not see the same picture. They consistently report that their costs are rising and have mostly negative things to say about anything related to health care costs.
According to a Louis A. Harris and Associates survey conducted last year for the Center for Studying Health System Change’s Community Snapshots Project, 64 percent of the 5,111 respondents reported that their out-of-pocket costs increased over the past three years, and 26 percent said their family health care costs are somewhat or completely out of control. Moreover, nearly 9 out of 10 respondents expect their out-of-pocket costs to rise.
Are consumers’ perceptions out of kilter with reality? Or have they benefited from the cost slowdown less than others? Some indicators suggest that the latter may account for part of the difference in their perceptions. The underwriting cycle, for example, caused the slowdown in premium growth to lag behind the slowing of health care costs in the early 1990s. From a consumers’ perspective, this means that people paying premiums have experienced slowing cost trends for fewer years.
|
||
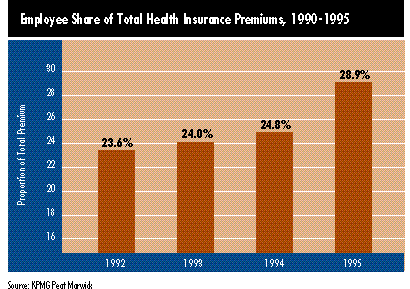
In addition, employees are paying an increasingly greater share of premiums. Between 1992 and 1995, employees’ share of the total health insurance premium rose from 23.6 percent to 28.9 percent. The 5.0 percent average annual increase in total premium cost over that period translates to a 12.3 percent per year increase in employee payments. And those with family coverage experienced an even greater increase.

With so many people switching to managed care plans, consumer perceptions also are likely to be influenced by the nature of their experience with managed care. Those who are comfortable with the provider network, and get most of their care through it, will be pleased with the reductions in deductibles and coinsurance and are more likely to see their costs as having stabilized. But those who use out-of-network providers extensively are more likely to perceive an increase in their costs.
What Lies Ahead?
![]() he first of the 1996 employer surveys -- KPMG Peat Marwick’s survey released in October -- reports that health insurance premiums increased 0.5 percent from spring 1995 to spring 1996. This is the lowest increase in health insurance recorded by this survey, according to Peat Marwick, down from 2.1 percent for 1995. Moreover, for the second year in a row, premiums increased less than overall inflation.
he first of the 1996 employer surveys -- KPMG Peat Marwick’s survey released in October -- reports that health insurance premiums increased 0.5 percent from spring 1995 to spring 1996. This is the lowest increase in health insurance recorded by this survey, according to Peat Marwick, down from 2.1 percent for 1995. Moreover, for the second year in a row, premiums increased less than overall inflation.
Given the trends for the ’90s, will lowered rates of increase continue? If they rise, will they soar to the double digits of the ’80s or will they remain well below the rates of the past? Based on the strong economy over the past few years, research on cost trends by Milliman & Robertson suggests an upturn in costs. But health care markets have changed so much in recent years that pressures to contain costs could lead to a continuation of very small cost increases. Such continuation may lead consumers to feel better about costs -- but only if the trend of employers’ shifting costs to employees abates.
|
||