
Prescription Drug Access Disparities Among Working-Age Americans
Issue Brief No. 73
December 2003
Marie C. Reed, J. Lee Hargraves
![]() orking-age African Americans and Latinos are much more likely than white
Americans to report they cannot afford all of their prescription drugs, according to
a new study by the Center for Studying Health System Change (HSC). In 2001,
nearly one in five blacks and one in six Latinos 18 to 64 years old did not purchase
all of their prescriptions because of cost, compared with slightly more than one in 10
whites. Cost-related prescription drug access problems are considerably higher for
people with chronic conditions,1 particularly African Americans. Regardless of race
or ethnicity, uninsured working-age people with chronic conditions are at particular
risk for not being able to afford all of their prescriptions, with about half reporting
cost-related prescription access problems. Increased patient cost sharing for
prescription drugs will likely increase prescription drug access disparities for
insured African Americans and Latinos, especially those with chronic conditions.
orking-age African Americans and Latinos are much more likely than white
Americans to report they cannot afford all of their prescription drugs, according to
a new study by the Center for Studying Health System Change (HSC). In 2001,
nearly one in five blacks and one in six Latinos 18 to 64 years old did not purchase
all of their prescriptions because of cost, compared with slightly more than one in 10
whites. Cost-related prescription drug access problems are considerably higher for
people with chronic conditions,1 particularly African Americans. Regardless of race
or ethnicity, uninsured working-age people with chronic conditions are at particular
risk for not being able to afford all of their prescriptions, with about half reporting
cost-related prescription access problems. Increased patient cost sharing for
prescription drugs will likely increase prescription drug access disparities for
insured African Americans and Latinos, especially those with chronic conditions.
- Blacks and Latinos More Likely to Go Without Prescriptions
- Large Gap for Minorities with Chronic Conditions
- Gaps Exist Among Insured But Not Among Uninsured
- More Disparities?
- Notes
- Data Source
- Supplementary Tables
Blacks and Latinos More Likely to Go Without Prescriptions
![]() pending on prescription drugs
continues to increase rapidly in
the United States, reflecting a growing
reliance on drugs to treat a variety of
health problems.Access to prescriptions
varies by race. For example, research
has shown that blacks are less likely
to be prescribed medicines than are
whites with similar health conditions.2
pending on prescription drugs
continues to increase rapidly in
the United States, reflecting a growing
reliance on drugs to treat a variety of
health problems.Access to prescriptions
varies by race. For example, research
has shown that blacks are less likely
to be prescribed medicines than are
whites with similar health conditions.2
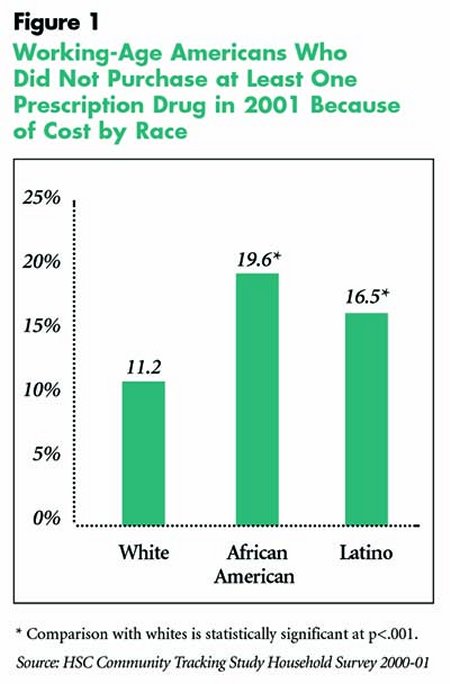
According to results from the Community Tracking Study (CTS) 2001 Household Survey (see Data Source), working-age African Americans and Latinos are considerably more likely than whites not to fill all of their prescriptions because of cost concerns (see Figure 1). Overall, about 20 percent of blacks, 16 percent of Latinos and 11 percent of non-Hispanic whites did not fill at least one prescription in 2001 because of cost concerns.
Back to Top
Large Gap for Minorities with Chronic Conditions
![]() hronic conditions contribute substantially
to racial and ethnic disparities in
health status in the United States, particularly
for African Americans, and are
among the principal reasons why blacks
die at younger ages and at a much higher
rate than white Americans.3 Black
Americans also are more likely to have
multiple chronic conditions.4
hronic conditions contribute substantially
to racial and ethnic disparities in
health status in the United States, particularly
for African Americans, and are
among the principal reasons why blacks
die at younger ages and at a much higher
rate than white Americans.3 Black
Americans also are more likely to have
multiple chronic conditions.4
Working-age African Americans and Latinos with chronic conditions were substantially more likely than whites to report not having filled at least one prescription in 2001 because of cost (see Table 1).More than 30 percent of blacks and a quarter of Latinos with chronic conditions didn’t purchase all of their prescriptions in 2001 because of cost, compared with 17 percent of whites living with chronic conditions.Workingage Latinos and blacks without chronic conditions were also more likely than whites to face prescription drug affordability problems. In general, however, people without chronic health problems are much less likely to report having problems purchasing their prescriptions.
Overall, the relative disparity in costrelated prescription drug access problems for African Americans and Latinos compared with whites is fairly similar regardless of the number of chronic conditions: blacks are about 75 percent and Latinos about 50 percent more likely than whites not to have purchased at least one prescription drug in 2001 because of cost issues. However, the absolute disparity or gap—the percentage point difference between the percent of whites and African Americans and Latinos with cost-related prescription drug access problems—is much greater for those with chronic conditions. This finding is important because prescription drugs are critical to ongoing treatment of many chronic conditions, and lack of access to appropriate prescription medication can result in pain,worsening of the condition and increased risk for other related health problems.
The size of the gap between minorities and whites in cost-related prescription drug access problems increases with the presence of chronic conditions. The gap between blacks and whites was 5 percentage points for those with no chronic conditions, 12 points for those with one condition and 15 points for people with multiple conditions. Similar, though generally smaller, gaps were found for Latinos as well. More than 35 percent of blacks and 30 percent of Latinos with multiple chronic conditions did not purchase all of their prescriptions in 2001 because of cost, compared with slightly more than 20 percent of whites.
Back to Top
 |
Gaps Exist Among Insured But Not Among Uninsured
![]() ninsured people were more than three times
as likely as those with private health coverage
to have gone without at least one prescription
in 2001 because of cost concerns (see Table 2).
However, previous HSC research shows that
drug-affordability problems are not limited to
the uninsured—about a quarter of working-age
people with Medicaid or other state coverage
did not purchase at least one prescription in
2001 because they could not afford it.5 African
Americans and Latinos are more likely to be
uninsured or to receive their health insurance
through a public program6, and, as a result,
members of these minority groups are more
likely to have problems affording all of their
prescriptions.
ninsured people were more than three times
as likely as those with private health coverage
to have gone without at least one prescription
in 2001 because of cost concerns (see Table 2).
However, previous HSC research shows that
drug-affordability problems are not limited to
the uninsured—about a quarter of working-age
people with Medicaid or other state coverage
did not purchase at least one prescription in
2001 because they could not afford it.5 African
Americans and Latinos are more likely to be
uninsured or to receive their health insurance
through a public program6, and, as a result,
members of these minority groups are more
likely to have problems affording all of their
prescriptions.
Uninsured African Americans, whites and Latinos were equally likely to report problems affording prescription drugs. All three groups had extremely high rates of affordability problems, particularly among those with chronic conditions. Regardless of race or ethnicity, about 50 percent of working-age uninsured people with chronic conditions reported cost-related prescription drug access problems. The rate for uninsured persons without chronic conditions was about half that level.
Similar to uninsured people, working-age people with public insurance, including Medicaid and Medicare, were more likely than privately insured people to report problems affording prescription drugs. In particular, publicly insured African Americans living with chronic conditions were much more likely than publicly insured whites or Latinos with chronic conditions to report problems affording all of their prescriptions. Even after accounting for socioeconomic factors such as income, age and gender that can affect both need and ability to pay, blacks with public insurance and at least one chronic condition were a third more likely than whites with public insurance and at least one chronic condition to have problems affording all of their prescription drugs.7 Some possible explanations for this disparity may include differences in individual and family financial pressures and resources as well as regional and individual factors not accounted for in the model.
Prescription drug access problems are lowest for the privately insured, regardless of race or ethnicity.However, significant racial and ethnic disparities in access to prescription drugs exist among those with private insurance, with the largest disparities among those with chronic conditions.Working-age, privately insured African Americans with chronic conditions were twice as likely as whites (22% compared with 11%) not to purchase all of their prescription drugs in 2001 because of cost concerns. Privately insured Latinos with chronic conditions (18%) also experienced more problems affording drugs than did whites. A prescription drug access gap also exists for privately insured African Americans and Latinos without chronic conditions.
There are a variety of explanations for these disparities, many of which are economic. For example, employed blacks and Latinos generally earn less than whites, and they are less likely to work for employers offering health plans with generous prescription benefits.And, if offered a choice of health plans, they may be more likely to select one with lower premiums—which generally provides fewer benefits and requires more patient cost sharing—to increase takehome pay.8 When income and other socioeconomic factors are taken into account, the prescription drug access gap for the privately insured with chronic conditions closes for Latinos but not for African Americans.
Back to Top
Table 1
Working-Age People Who Did Not Purchase at Least One Prescription
Drug in 2001 Because of Cost by Number of Chronic Conditions1
| Number of Chronic Conditions | ||||
| At Least One | None | One | Two or More | |
| Percent With Cost-Related Prescription Drug Access Problems | ||||
| All | 19.8% | 9.7% | 16.9% | 24.8% |
| White | 17.0 | 8.3 | 14.6 | 21.3 |
| African American | 30.7*** | 13.4*** | 26.7*** | 35.9*** |
| Latino | 25.7*** | 13.7*** | 23.0*** | 31.7** |
| Percentage Point Gap2 Compared to Whites | ||||
| African American | 13.6 | 5.1 | 12.1 | 14.6 |
| Latino | 8.7 | 5.5 | 8.4 | 10.4 |
| 1 People were classified as having a chronic condition if during the previous two years they had seen a doctor or health professional
for at least one of the following conditions: diabetes, arthritis, asthma, chronic obstructive pulmonary disease, heart disease, hypertension,
cancer or depression. 2 The gap equals the estimate for minority group minus the estimate for whites. Slight differences from estimates calculated directly from table are due to rounding. Comparison with whites is statistically significant: *** p<.001, ** p<.01. Source: HSC Community Tracking Study Household Survey 2000-01 | ||||
Table 2
Working-Age People Who Did Not Purchase at Least One Prescription Drug
in 2001 Because of Cost by Chronic Condition Status1 and Type of Insurance
| Insurance Type | ||||
| Private | Public2 | Uninsured | ||
| All Persons 18-64 | 8.0% | 23.7% | 29.0% | |
| At Least One Chronic Condition | ||||
| White | 10.8 | 29.8 | 52.1 | |
| African American | 21.5*** | 38.1** | 54.0 | |
| Latino | 17.8*** | 24.8 | 46.2 | |
| No Chronic Condition | ||||
| White | 5.0 | 14.5 | 24.5 | |
| African American | 9.9*** | 13.2 | 22.6 | |
| Latino | 9.4*** | 12.7 | 19.9 | |
| 1 People were classified as having a chronic condition if during the previous two years they had seen a doctor or health professional
for at least one of the following conditions: diabetes, arthritis, asthma, chronic obstructive pulmonary disease, heart disease, hypertension,
cancer or depression. 2 Public insurance includes Medicaid,Medicare and other public insurance. Comparison with whites is statistically significant: *** p<.001, ** p<.01. Source: HSC Community Tracking Study Household Survey 2000-01 | ||||
More Disparities?
![]() s private and public payers grapple with rising
health care costs, including those related to drug
price and volume increases, consumers are being
asked to pay more for their prescription drugs
in a variety of ways. Some have higher copayments,
and most plans now include tiered
copayments where patients pay more for brandname
drugs and those not on a preferred list.
Others have prescription drug coverage with
coinsurance, where patients pay a percentage
of the total drug cost rather than a fixed
copayment. Price sensitivity to prescription
purchases is strong, particularly among lowincome
people, meaning that even minimal
patient out-of-pocket costs can result in people
failing to fill their prescriptions.9
s private and public payers grapple with rising
health care costs, including those related to drug
price and volume increases, consumers are being
asked to pay more for their prescription drugs
in a variety of ways. Some have higher copayments,
and most plans now include tiered
copayments where patients pay more for brandname
drugs and those not on a preferred list.
Others have prescription drug coverage with
coinsurance, where patients pay a percentage
of the total drug cost rather than a fixed
copayment. Price sensitivity to prescription
purchases is strong, particularly among lowincome
people, meaning that even minimal
patient out-of-pocket costs can result in people
failing to fill their prescriptions.9
African Americans and Latinos are much more likely to have lower incomes than are whites, putting them at greater risk for increased problems paying for their drugs as out-of-pocket costs escalate. And since African Americans and Latinos with chronic health conditions are much more likely than whites to have problems affording all of their prescription drugs already, prescription drug access disparities among those with chronic conditions are likely to increase as patient cost sharing increases. Rising out-ofpocket prescription drug costs may undercut efforts to reduce racial and ethnic disparities in access to health care, including prescription drugs,with the greatest effect on reduced access for minorities with chronic conditions.
Back to Top
Notes
| 1. | People were classified as having a chronic condition if during the previous two years they had seen a doctor or health professional for at least one of the following conditions: diabetes, arthritis, asthma, chronic obstructive pulmonary disease, heart disease, hypertension, cancer or depression. |
| 2. | Unequal Treatment: Confronting Racial and Ethnic Disparities in Health Care, Institute of Medicine, National Academy Press,Washington, D.C. (2003). |
| 3. | Keppel, Kenneth, Jeffrey Pearcy and Diane Wagener, "Trends in Racial and Ethnic-Specific Rates for the Health Status Indicators: United States, 1990-98,"Healthy People Statistical Notes, No. 23, National Center for Health Statistics, Hyattsville, Md. (January 2002). |
| 4. | Sixteen percent of blacks aged 18-64 reported having more than one chronic condition in 2001, compared with 12 percent of whites and 7 percent of Latinos. See Supplemental Table 1 associated with this Issue Brief at www.hschange.org for additional information on chronic condition status by race. |
| 5. | Cunningham, Peter, Prescription Drug Access: Not Just a Medicare Problem, Issue Brief No. 51, Center for Studying Health System Change, Washington, D.C. (April 2002). |
| 6. | Thirty-nine percent of working-age blacks had public insurance or were uninsured in 2001. The rate for Latinos was 48 percent. See Supplementary Table 2 associated with this Issue Brief for additional information on insurance type and race. |
| 7. | See Supplemental Table 3 associated with this Issue Brief for details on the results of the multivariate model at www.hschange.org. |
| 8. | See Supplemental Table No.1 at www.hschange.org/ CONTENT/443/?supp=1, associated with Hargraves, J. Lee, The Insurance Gap and Minority Health Care, 1997-2001, Tracking Report No. 2, Center for Studying Health System Change,Washington, D.C. (June 2002). |
| 9. | Hwang,Wenke, et al., "Out-of-Pocket Medical Spending for Care of Chronic Conditions," Health Affairs,Vol. 20, No. 6 (November/December 2001). |
Back to Top
Data Source
This Issue Brief presents findings from the HSC Community Tracking Study Household Survey, a nationally representative telephone survey of the civilian, noninstitutionalized population conducted in 2000-01. Data were supplemented by in-person interviews of households without telephones to ensure proper representation. The survey contains information on about 60,000 people, including approximately 37,000 white, Latino and African Americans 18 to 64 years of age. The response rate was 59 percent. Estimates in the Issue Brief reflect the percentage of working-age adults who responded "yes" to the following question: "During the past 12 months, was there any time you needed prescription medicines but didn’t get them because you couldn’t afford it?" More detailed information on survey methodology can be found on this Web site.
Back to Top
Supplementary Tables
Supplementary Table 1: Chronic
Condition Status of Persons 18-64 by Race/Ethnic Group
Supplementary Table 2: Insurance
Type of Persons 18-64 by Race/Ethnic Group
Supplementary Table 3: Adjusted
Odds Ratios for Not Purchasing At Least One Prescription Drug in 2001 Because
of Cost: Persons 18-64
Supplementary Table 4: Predicted
Percentages of Persons 18-64 Not Purchasing at Least One Prescription Drug in
2001 Because of Cost
ISSUE BRIEFS are published by the
Center for Studying Health System Change.
600 Maryland Avenue, SW, Suite 550
Washington, DC 20024-2512
Tel: (202) 484-5261
Fax: (202) 484-9258
www.hschange.org
Vice President: Len M. Nichols