
Treading Water: Americans' Access to Needed Medical Care, 1997-2001
Tracking Report No. 1
March 2002
Bradley C. Strunk, Peter J. Cunningham
![]() espite unprecedented economic growth, low unemployment
and fewer uninsured people, Americans’ ability to get needed
medical care failed to improve significantly between 1997 and
2001, according to findings from the Center for Studying Health
System Change’s (HSC) Community Tracking Study Household
Survey. While most people get the care they believe they need,
about one in seven Americans reported some difficulty obtaining
needed care in 2001—about the same as in 1997. At the
same time, health system-related problems—such as the ability
to get timely appointments—increased, suggesting possible
health system capacity constraints are emerging. On a brighter
note, children’s ability to get needed care improved.
espite unprecedented economic growth, low unemployment
and fewer uninsured people, Americans’ ability to get needed
medical care failed to improve significantly between 1997 and
2001, according to findings from the Center for Studying Health
System Change’s (HSC) Community Tracking Study Household
Survey. While most people get the care they believe they need,
about one in seven Americans reported some difficulty obtaining
needed care in 2001—about the same as in 1997. At the
same time, health system-related problems—such as the ability
to get timely appointments—increased, suggesting possible
health system capacity constraints are emerging. On a brighter
note, children’s ability to get needed care improved.
- Trends in Americans’ Ability to Get Care
- Insured vs. Uninsured: The Gap Persists
- Low-Income People Face More Problems Getting Care
- Health Status Matters
- Cost Remains Top Barrier to Care
- Different Problems Emerging
- Insurance Troubles Increase
- Children’s Access to Care
- Rough Waters Ahead
- Data Sources
- Notes
- Web-Exclusive Tables
Trends in Americans’ Ability to Get Care
![]() hile the majority of Americans believe they get the medical
care they need, millions do not. In 2001, almost 16 million people in the United
States reported they were unable to get needed medical care. Another 26 million
people delayed needed care in the previous 12 months. Altogether, more than
15 percent of Americans, or about 41 million people, reported not getting or
delaying needed care in 2001 (see Data Sources).
hile the majority of Americans believe they get the medical
care they need, millions do not. In 2001, almost 16 million people in the United
States reported they were unable to get needed medical care. Another 26 million
people delayed needed care in the previous 12 months. Altogether, more than
15 percent of Americans, or about 41 million people, reported not getting or
delaying needed care in 2001 (see Data Sources).
Despite a strong economy, fewer uninsured people and record low unemployment, overall rates of unmet need and delayed care—two important measures of access to care—failed to improve between 1997 and 2001 (see Figure 1 and Table 1). In fact, the frequency of unmet medical needs in the U.S. population, defined as the inability to get needed medical care at some point in the previous year, increased slightly, from 5.2 percent in 1997 to 5.8 percent in 2001. Reports of delayed care held steady between 1997 and 2001.
The lack of improvement in access to care during one of the most prosperous times in American history is not encouraging. Instead, Americans increasingly appear to be facing problems with aspects of health care not directly related to general economic trends. These include getting timely physician and clinic appointments, having medical providers accept their health insurance and getting their health insurer to pay for services. A weak economy could intensify problems with access to care by increasing unemployment and the number of people who are uninsured.
FIGURE 1: Access Gap Persists: Unmet Need for Insured vs. Uninsured People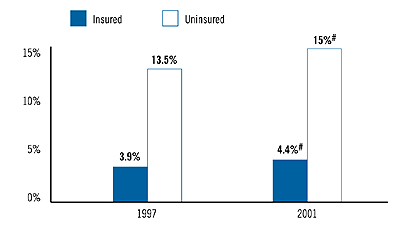 Note: See Table 1 for additional data on access to care. # Change from 1997 to 2001 is statistically significant at p<.05. Source: HSC Community Tracking Study Household Survey |
| TABLE 1: Indicators of Access to Care for the U. S. Population | ||||
|
1997
|
1999
|
2001
|
||
| All People | ||||
|
5.2%
|
5.6%*
|
5.8%#
|
|
|
9.8
|
8.5*
|
9.5*
|
|
|
15.0
|
14.1*
|
15.2*
|
|
| Insured People | ||||
|
3.9
|
4.3*
|
4.4#
|
|
|
8.7
|
7.6*
|
8.6*
|
|
|
12.5
|
11.9*
|
13.0*
|
|
| Uninsured People | ||||
|
13.5
|
14.2
|
15.0#
|
|
|
17.1
|
14.1*
|
15.7
|
|
|
30.6
|
28.2*
|
30.6*
|
|
| Notes: If a person reported
both an unmet need and delayed care, that person is counted as having an
unmet need only. An unmet need means a person did not get needed medical
care at some point during the previous 12 months. Delayed care means the
person put off or postponed getting needed medical care at some point during
the previous 12 months. * Change from previous survey is statistically significant at p<.05. # Change from 1997 to 2001 is statistically significant at p<.05. Source: HSC Community Tracking Study Household Survey |
||||
Back to Top
Insured vs. Uninsured: The Gap Persists
![]() etting needed medical care continues to be a
bigger problem for people without health insurance
coverage. Trends are roughly similar for insured
and uninsured people, so that the long-standing disparities
in access hardly changed between 1997 and
2001. For example, 4.4 percent of insured people
reported an unmet need in 2001, up from 3.9 percent
in 1997. Likewise, 15 percent of uninsured
people reported an unmet need in 2001, up from
13.5 percent in 1997.
etting needed medical care continues to be a
bigger problem for people without health insurance
coverage. Trends are roughly similar for insured
and uninsured people, so that the long-standing disparities
in access hardly changed between 1997 and
2001. For example, 4.4 percent of insured people
reported an unmet need in 2001, up from 3.9 percent
in 1997. Likewise, 15 percent of uninsured
people reported an unmet need in 2001, up from
13.5 percent in 1997.
Uninsured Americans in 2001, compared to 1997, were still about three times as likely not to get needed care as insured people. And, uninsured people in 2001 remained almost twice as likely to delay needed care as insured people—15.7 percent vs. 8.6 percent.
Back to Top
Low-Income People Face More Problems Getting Care
![]() oth low-income and high-income people experienced
little or no increase in unmet need between 1997 and
2001. Despite small fluctuations, disparities in access to
care by income remained about as high in 2001 as in
1997. And, low-income, uninsured people, whose incomes
were below 200 percent of poverty, or about $35,000 a
year for a family of four in 2001, continued to have the
most trouble getting needed care, with 16.4 percent
reporting an unmet need in 2001, which was not statistically
different from 1997 (see Table 2).
oth low-income and high-income people experienced
little or no increase in unmet need between 1997 and
2001. Despite small fluctuations, disparities in access to
care by income remained about as high in 2001 as in
1997. And, low-income, uninsured people, whose incomes
were below 200 percent of poverty, or about $35,000 a
year for a family of four in 2001, continued to have the
most trouble getting needed care, with 16.4 percent
reporting an unmet need in 2001, which was not statistically
different from 1997 (see Table 2).
Low-income people remained almost twice as likely to report an unmet need in 2001 as higher-income people—8.1 percent vs. 4.7 percent. Interestingly, the rate of unmet need for higher-income people increased from 3.9 percent in 1997 to 4.7 percent in 2001, a statistically significant change. The rate of unmet need also increased for low-income people, from 7.5 percent in 1997 to 8.1 percent in 2001, although this increase was not statistically significant. Overall, rates of delayed care did not differ substantially by income.
| TABLE 2: Americans’ Likelihood of Having an Unmet Need, by Family Income and Health Status | ||||
|
1997
|
1999
|
2001
|
||
| Family Income | ||||
|
7.5%
|
8.1%
|
8.1%
|
|
|
5.2
|
5.8
|
5.6
|
|
|
14.9
|
15.0
|
16.4
|
|
|
3.9
|
4.3*
|
4.7*#
|
|
|
3.3
|
3.6*
|
4.0*#
|
|
|
11.0
|
12.7*
|
13.1#
|
|
| Health Status | ||||
|
11.9
|
11.9
|
13.0
|
|
|
8.6
|
8.7
|
10.0*#
|
|
|
27.7
|
26.3
|
26.8
|
|
|
4.2
|
4.7*
|
4.6#
|
|
|
3.2
|
3.7*
|
3.6#
|
|
|
10.7
|
11.7
|
12.2#
|
|
| * Change from previous survey is
statistically significant at p<.05. # Change from 1997 to 2001 is statistically significant at p<.05. Source: HSC Community Tracking Study Household Survey |
||||
Back to Top
Health Status Matters
![]() eople who reported fair or poor health remained almost
three times as likely not to get needed care as people who
reported their health was good or excellent—13 percent
vs. 4.6 percent in 2001. Disparities in delayed care were
not as great, but people with health problems were still
more likely to delay care than healthier people, and these
disparities remained fairly constant between 1997 and
2001. Greater difficulty getting medical care among people
with health problems reflects in large part their
greater need for care and, thus, more opportunities
to experience problems with the health care system.
eople who reported fair or poor health remained almost
three times as likely not to get needed care as people who
reported their health was good or excellent—13 percent
vs. 4.6 percent in 2001. Disparities in delayed care were
not as great, but people with health problems were still
more likely to delay care than healthier people, and these
disparities remained fairly constant between 1997 and
2001. Greater difficulty getting medical care among people
with health problems reflects in large part their
greater need for care and, thus, more opportunities
to experience problems with the health care system.
Uninsured people in poor or fair health continued to have the most trouble getting needed care, with 26.8 percent reporting an unmet need in 2001, down slightly from 27.7 percent in 1997, but the change was not statistically significant.
Back to Top
Cost Remains Top Barrier to Care
![]() ost remained the most frequently cited barrier to getting
needed care (see Table 3), and trends were virtually
flat from 1997 to 2001. Among people with an unmet
need or who delayed care, about 62 percent in both 1997
and 2001 reported difficulty getting care because of worries
about cost. Not surprisingly, cost was overwhelmingly
the main barrier to care for the uninsured: 93.1 percent
of the uninsured cited cost as the reason for difficulty
getting care in 2001, almost unchanged from 1997.
Nevertheless, more than half of people with insurance
also cited cost as a barrier.
ost remained the most frequently cited barrier to getting
needed care (see Table 3), and trends were virtually
flat from 1997 to 2001. Among people with an unmet
need or who delayed care, about 62 percent in both 1997
and 2001 reported difficulty getting care because of worries
about cost. Not surprisingly, cost was overwhelmingly
the main barrier to care for the uninsured: 93.1 percent
of the uninsured cited cost as the reason for difficulty
getting care in 2001, almost unchanged from 1997.
Nevertheless, more than half of people with insurance
also cited cost as a barrier.
| TABLE 3: Reasons for Access Problems | |||
|
1997
|
1999
|
2001
|
|
| All People | |||
| Worried About the Cost |
62.4%
|
61.2%
|
62.6%
|
| Health System-Related |
45.2
|
50.7*
|
53.8*#
|
| Health Plan-Related |
23.7
|
24.9
|
28.4*#
|
| Insured People | |||
| Worried About the Cost |
51.2
|
49.6
|
52.3*
|
| Health System-Related |
54.0
|
58.9*
|
62.4*#
|
| Health Plan-Related |
28.5
|
29.4
|
33.4*#
|
| Uninsured People | |||
| Worried About the Cost |
91.5
|
92.4
|
93.1
|
| Health System-Related |
22.0
|
28.6*
|
28.5#
|
| Health Plan-Related |
N/A
|
N/A
|
N/A
|
| Notes: Percentages for a
particular group do not add up to 100 percent because a person was permitted
to cite more than one reason. See Table 4 for a detailed list of reasons
for access problems. * Change from previous survey is statistically significant at p<.05. # Change from 1997 to 2001 is statistically significant at p<.05. Source: HSC Community Tracking Study Household Survey |
|||
Back to Top
Different Problems Emerging
![]() hile trends in overall access changed little, there were
greater changes in the types of problems people experienced with the health
care system. Specifically, more people reported system—related problems
and health insurance—related barriers.
hile trends in overall access changed little, there were
greater changes in the types of problems people experienced with the health
care system. Specifically, more people reported system—related problems
and health insurance—related barriers.
More than half of people who had problems getting care cited health system-related barriers as a reason—up from 45.2 percent in 1997 to 53.8 percent in 2001. Specifically, people reported more problems getting appointments, getting through on the telephone to medical providers and getting to a doctor’s office or clinic when it was open (see Table 4). Similar trends were found for both insured and uninsured people, with 62.4 percent of insured people citing system problems in 2001, up from 54 percent in 1997, and 28.5 percent of the uninsured citing system problems in 2001, up from 22 percent in 1997.
Other survey data appear to confirm that more people are having problems scheduling appointments. The percentage of people who waited more than three weeks for an appointment for a checkup or general examination increased from 24.4 percent in 1997 to 27.4 percent in 2001 (see Figure 2).Waiting times also increased for people scheduling appointments for a specific illness or injury, with the percentage of people waiting more than a week for such visits increasing from 22.2 percent in 1997 to 28 percent in 2001.
Longer waiting times for appointments suggest growing physician capacity constraints, and some experts are predicting physician shortages.1 And, the prospect of crowded hospital emergency departments also might discourage people with nonurgent problems from seeking care there and increase the demand on office-based physicians.2
FIGURE 2: Appointment Waiting Times for Last Physician Visit
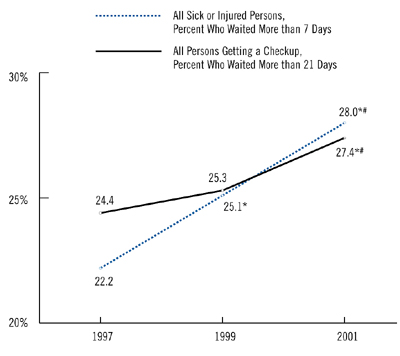 * Change from previous survey is statistically significant at p<.05. # Change from 1997 to 2001 is statistically significant at p<.05. Source: HSC Community Tracking Study Household Survey |
| TABLE 4: Detailed Reasons for Access Problems | ||||
|
1997
|
1999
|
2001
|
||
| Worried About the Cost |
62.4%
|
61.2%
|
62.6%
|
|
| Health Plan-Related | ||||
|
9.7
|
10.6
|
13.2*#
|
|
|
17.1
|
19.3*
|
22.2*#
|
|
|
0.6
|
0.5
|
0.6
|
|
|
0.9
|
0.9
|
0.7
|
|
| Health System-Related | ||||
|
22.9
|
29.7*
|
32.6*#
|
|
|
19.5
|
21.3*
|
24.0*#
|
|
|
9.6
|
11.8*
|
12.2#
|
|
|
6.9
|
9.7*
|
12.3*#
|
|
|
1.1
|
1.0
|
0.8#
|
|
|
2.1
|
1.6*
|
1.5#
|
|
|
1.5
|
1.1*
|
0.9#
|
|
|
1.0
|
2.5*
|
2.1#
|
|
| Notes: The universe for this table is all persons who reported an unmet need or delaying care. Percentages for a particular group do not add up to 100 percent because a person was permitted to cite more than one reason. * Change from previous survey is statistically significant at p<.05. # Change from 1997 to 2001 is statistically significant at p<.05. Source: HSC Community Tracking Study Household Survey |
||||
Back to Top
Insurance Troubles Increase
![]() or insured people, the percentage reporting problems with
their insurance increased from 28.5 percent in 1997 to 33.4 percent in 2001.
In particular, more people reported their health plan would not pay for a service
and their medical providers would not accept their insurance.
or insured people, the percentage reporting problems with
their insurance increased from 28.5 percent in 1997 to 33.4 percent in 2001.
In particular, more people reported their health plan would not pay for a service
and their medical providers would not accept their insurance.
Increases in health plan-related problems may be related in part to growing instability in some health plan provider networks. Increasingly, some hospitals and physicians are testing greater bargaining clout with health plans, with some providers dropping out of health plan networks if they are unable to secure more favorable contracts.3, 4 This increased network instability could help to explain the increase in the percentage of people reporting problems getting care because their provider would not accept their insurance.
It is less clear why more people are reporting difficulty getting care because their plan refused to pay for the service—especially since plans’ restrictions on enrollee access to providers and services appear to have eased somewhat in recent years. However, there have been reports of health plans excessively delaying provider payments, which could result in some providers refusing services to patients who have delinquent accounts because of insurer delays.
Another factor that might contribute to consumers’ perception of more health plan-related barriers could be the continuing shift of insured workers from traditional indemnity insurance plans to some form of managed care. In 1996, 27 percent of workers were enrolled in indemnity plans, but by 2001, only 7 percent had indemnity coverage.5 For example, people moving from indemnity insurance into some form of managed care, even less restrictive preferred provider organizations, might have to choose between an in-network or out-of-network provider for the first time.
Back to Top
Children’s Access to Care
![]() ncreasingly, policy makers have focused on children’s health
in recent years. Most notably in 1997, Congress passed the State Children’s
Health Insurance Program (SCHIP), which may account for the decrease in the
rate of uninsured children under age 18, from 12.1 percent in 1997 to 9.2 percent
in 2001, according to the Community Tracking Study Household Survey. Generally,
SCHIP allows states to expand coverage to children in families whose income
is too high for Medicaid but too low to afford private insurance.
ncreasingly, policy makers have focused on children’s health
in recent years. Most notably in 1997, Congress passed the State Children’s
Health Insurance Program (SCHIP), which may account for the decrease in the
rate of uninsured children under age 18, from 12.1 percent in 1997 to 9.2 percent
in 2001, according to the Community Tracking Study Household Survey. Generally,
SCHIP allows states to expand coverage to children in families whose income
is too high for Medicaid but too low to afford private insurance.
Contrary to the findings for the general population, children’s ability to get care improved. The percentage of children reporting any difficulty getting care decreased from 6.3 percent in 1997 to 5.1 percent in 2001 (see Table 5). Problems with unmet need and delayed care both decreased, although the decrease in unmet need among children was not statistically significant.
The ability to get care improved by about the same amount for both low-income and higher-income children, although changes for both groups were not statistically significant due to smaller samples. While SCHIP and other programs for low-income children may be contributing to these positive trends, the improvement in access to care among children does not appear to be limited just to low-income children.
Despite significant increases in access, almost 2 million children could not get needed care in 2001, while another 1.7 million children, or 2.4 percent, delayed needed care. As with the general population, uninsured and low-income children and children with health problems faced more difficulty getting care.
| TABLE 5: Indicators of Access to Care for Children, by Insurance Status and Family Income | |||
|
1997
|
1999
|
2001
|
|
| All Children | |||
| Unmet Need |
3.2%
|
3.1%
|
2.7%
|
| Delayed Care |
3.1
|
2.4*
|
2.4#
|
| Either Type of Problem |
6.3
|
5.5
|
5.1#
|
| Insurance Status | |||
| Insured Children | |||
| Unmet Need |
2.4
|
2.5
|
2.3
|
| Delayed Care |
2.7
|
2.1*
|
2.0#
|
| Either Type of Problem |
5.1
|
4.6
|
4.3#
|
| Uninsured Children | |||
| Unmet Need |
9.7
|
7.7
|
7.1
|
| Delayed Care |
5.6
|
5.4
|
6.6
|
| Either Type of Problem |
15.2
|
13.1
|
13.6
|
| Family Income | |||
| Below 200% of Poverty | |||
| Unmet Need |
4.6
|
4.8
|
3.8
|
| Delayed Care |
3.5
|
3.1
|
3.1
|
| Either Type of Problem |
8.1
|
7.8
|
6.8
|
| Above 200% of Poverty | |||
| Unmet Need |
2.1
|
1.8
|
2.0
|
| Delayed Care |
2.7
|
2.0*
|
2.1
|
| Either Type of Problem |
4.8
|
3.8*
|
4.1
|
| Note: If a child experienced
both an unmet need and delayed care, that child is counted as having an
unmet need only. Unmet need means a child did not get needed medical care
at some point during the previous 12 months. Delayed care means the child
put off or postponed getting needed medical care at some point during the
previous 12 months. * Change from previous survey is statistically significant at p<.05. # Change from 1997 to 2001 is statistically significant at p<.05. Source: HSC Community Tracking Study Household Survey |
|||
Back to Top
Rough Waters Ahead
![]() ince 2001, the US economy has weakened considerably, and
unemployment has risen. If these economic trends continue, the number of uninsured
is likely to rise, along with the number of Americans who face financial barriers
to care. State budget shortfalls and other financial pressures on the health
care safety net, along with a decrease in the proportion of physicians providing
charity care,6 could lead to further deterioration
in access to care for uninsured people.
ince 2001, the US economy has weakened considerably, and
unemployment has risen. If these economic trends continue, the number of uninsured
is likely to rise, along with the number of Americans who face financial barriers
to care. State budget shortfalls and other financial pressures on the health
care safety net, along with a decrease in the proportion of physicians providing
charity care,6 could lead to further deterioration
in access to care for uninsured people.
And, problems are emerging that could affect people’s ability to get care, including rising health care costs that may prompt some employers either to drop health benefits or pass on more costs to workers, a severe nursing shortage, an undersupply of physicians in certain areas, providers dropping out of health plan networks and emergency department crowding.
Policy makers are discussing options to increase access to care. Insurance coverage expansions through tax credits or public coverage or extending coverage to families of unemployed persons could help offset losses in coverage because of the weak economy. In addition, expansions of federally supported community health centers could increase the availability of free or low-cost care for uninsured people even as market pressures reduce their access to private health care providers.
Back to Top
Data Sources
![]() his Tracking Report presents findings from the HSC Community
Tracking Study Household Survey, a nationally representative telephone survey
of the civilian, noninstitutionalized population conducted in 1996-97, 1998-99
and 2000-01. Each of the surveys was conducted over a roughly 12-month period
that overlapped two calendar years (e.g., from September 2000 to September 2001).
For ease of presentation and discussion, we refer only to a single calendar
year for each of the surveys (1997, 1999 and 2001), although the results also
reflect the latter part of the preceding year for each of the surveys. Data
were supplemented by in-person interviews of households without telephones to
ensure proper representation. Each round of the survey contains information
on about 60,000 people, and response rates ranged from 60 percent to 65 percent.7
his Tracking Report presents findings from the HSC Community
Tracking Study Household Survey, a nationally representative telephone survey
of the civilian, noninstitutionalized population conducted in 1996-97, 1998-99
and 2000-01. Each of the surveys was conducted over a roughly 12-month period
that overlapped two calendar years (e.g., from September 2000 to September 2001).
For ease of presentation and discussion, we refer only to a single calendar
year for each of the surveys (1997, 1999 and 2001), although the results also
reflect the latter part of the preceding year for each of the surveys. Data
were supplemented by in-person interviews of households without telephones to
ensure proper representation. Each round of the survey contains information
on about 60,000 people, and response rates ranged from 60 percent to 65 percent.7
Estimates of unmet need and delayed care were based on the following two questions: (1) “During the past 12 months, was there any time when you didn’t get the medical care you needed?” and (2) “Was there any time during the past 12 months when you put off or postponed getting medical care that you thought you needed?” For those reporting either unmet needs or delayed care, follow-up questions were asked to determine why. Responses included worry about cost, problems with health insurance, problems with availability of medical providers and personal reasons such as lack of time or procrastination. This Tracking Report includes only responses where at least one of the reasons had something to do with the health care system, and responses related only to personal reasons were not considered as unmet need or delayed care.
Insurance status reflects coverage on the day of the interview and includes coverage obtained through employer-sponsored private insurance, individually purchased private insurance, Medicare, Medicaid, other state programs, CHAMPUS and the Indian Health Service.
Back to Top
Notes
Web-Exclusive Data Tables for Tracking Report 1
- Web Table 1
Unmet Medical Needs among the U.S. Population - Web Table 2
Unmet Medical Needs Among all U.S. Adults (Ages 18 and Over) - Web Table 3
Unmet Medical Needs among All U.S. Children (Less than age 18) - Web Table 4
Delayed Medical Care Seeking among the U.S. Population - Web Table 5
Delayed Medical Care Seeking among All U.S. Adults (Ages 18 and Over) - Web Table 6
Delayed Medical Care Seeking among All U.S. Children (Less than age 18) - Web Table 7
Access Problems among the U.S. Population - Web Table 8
Access Problems among All U.S. Adults (Ages 18 and Over) - Web Table 9
Access Problems among all U.S. Children (Less than Age 18)
TRACKING REPORTS are published by the Center for Studying Health System
Change.
President: Paul B. Ginsburg
Director of Public Affairs: Richard Sorian
Editor: The Stein Group
For additional copies or to be added to the mailing list, contact HSC at:
600 Maryland Avenue, SW
Suite 550
Washington, DC 20024-2512
Tel: (202) 554-7549 (for publication information)
Tel: (202) 484-5261 (for general HSC information)
Fax: (202) 484-9258
www.hschange.org