
| News Releases |
||
A Snapshot of U.S. Physicians: Key Findings from the 2008 Health Tracking Physician Survey
Data Bulletin No. 35
September 2009
Ellyn R. Boukus, Alwyn Cassil, Ann S. O'Malley
![]() hysicians are the linchpins of the U.S. health care system
because their clinical decisions affect how up to 90 percent of every health
care dollar is spent.1 As health care spending continues
to rise rapidly, the number of uninsured Americans grows and quality of care
remains uneven, there is an urgent need to increase the value of the nation’s
$2.4 trillion annual spending on health care.
hysicians are the linchpins of the U.S. health care system
because their clinical decisions affect how up to 90 percent of every health
care dollar is spent.1 As health care spending continues
to rise rapidly, the number of uninsured Americans grows and quality of care
remains uneven, there is an urgent need to increase the value of the nation’s
$2.4 trillion annual spending on health care.
If policy makers are to guide the health care system toward greater value, they need timely, credible information about physicians and their practice of medicine. The nationally representative Center for Studying Health System Change (HSC) 2008 Health Tracking Physician Survey covers a wide variety of physician and practice dimensions, from basic demographic characteristics, practice organization and career satisfaction to insurance acceptance, compensation arrangements and charity care provision.
Unfortunately, because of changes in survey administration, results from the 2008 Health Tracking Physician Survey cannot be compared to findings from earlier HSC Community Tracking Study Physician Surveys. Yet, as the nation engages in the most serious discussion of comprehensive health care reform in 15 years, the 2008 physician survey establishes a new baseline that will allow future tracking of how physicians organize and practice medicine.
A Snapshot of U.S. Physicians
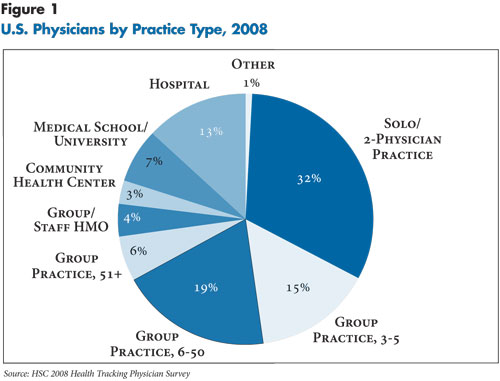
![]() n 2008, nearly one-third of physicians worked in solo or
two-physician practices, 15 percent worked in groups of three to five physicians,
and 19 percent worked in practices of six to 50 physicians (see Figure
1). Thirteen percent practiced in hospital settings, with 44 percent of
hospital-based physicians working in office practices or clinics, and the remainder
split evenly between emergency rooms and hospital staff. Three percent of physicians
worked in community health centers (CHCs) and 4 percent in group or staff-model
health maintenance organizations (HMOs).
n 2008, nearly one-third of physicians worked in solo or
two-physician practices, 15 percent worked in groups of three to five physicians,
and 19 percent worked in practices of six to 50 physicians (see Figure
1). Thirteen percent practiced in hospital settings, with 44 percent of
hospital-based physicians working in office practices or clinics, and the remainder
split evenly between emergency rooms and hospital staff. Three percent of physicians
worked in community health centers (CHCs) and 4 percent in group or staff-model
health maintenance organizations (HMOs).
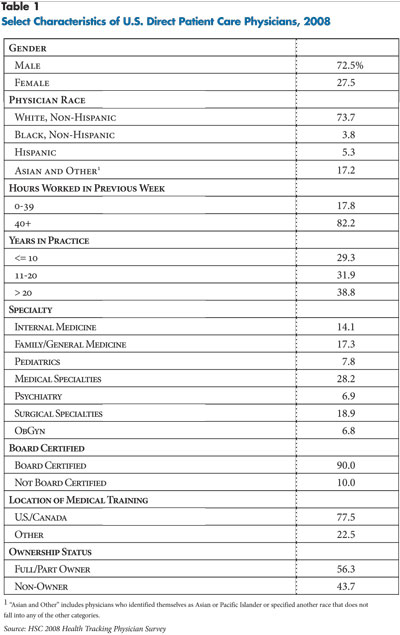
Almost three-quarters of U.S. physicians were men in 2008 (see Table 1). But for physicians under age 40, slightly more than 41 percent were women, signaling how the composition of the physician workforce may change in the future (findings not shown).
Three out of four physicians identified themselves as white, non-Hispanic, while 3.8 percent were black, non-Hispanic, 5.3 percent were Hispanic, and 17.2 percent were Asian or other races. However, among physicians under age 40, about two-thirds were white and 33 percent were minority—black (4%), Hispanic (5.4%), and Asian or other race (24%) (findings not shown).
More than 80 percent of physicians surveyed worked full time, more than half (53%) were 40 to 55 years old, and almost four in 10 have practiced medicine for more than 20 years. Nine in 10 physicians were board certified, and 22 percent received their medical training outside of the United States or Canada. Almost 40 percent were primary care physicians, 35.1 percent were medical specialists, including psychiatrists, and 25.7 percent were surgeons, including obstetrician/gynecologists.
A slight majority of physicians (56%) were either full or part owners of their practices, while 44 percent were employees or independent contractors.
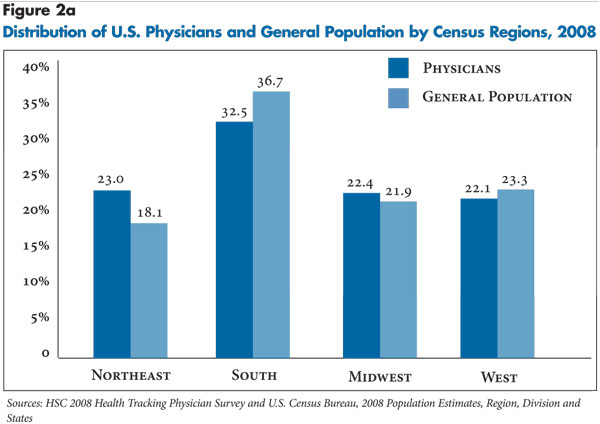
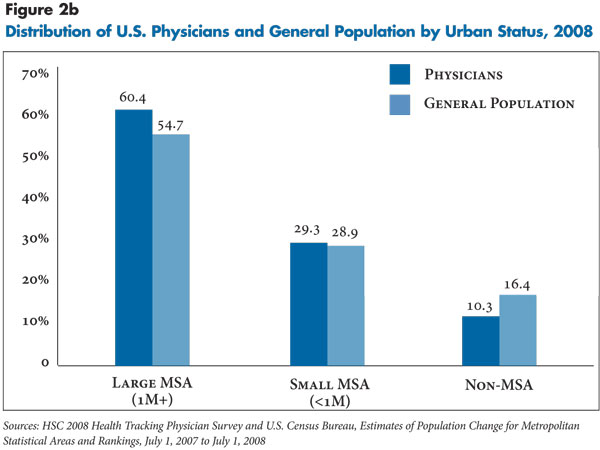
When comparing the geographic distribution of physicians to the U.S. population at large, physicians were overrepresented in the Northeast and large metropolitan areas—likely reflecting in some cases patients traveling to urban areas for specialized services—and underrepresented in the South (see Figures 2a and 2b).
Back to Top
Physician Compensation Arrangements
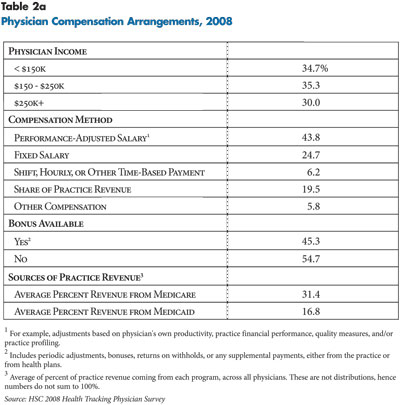
![]() n 2008, 44 percent of physicians reported receiving some
form of performance-adjusted salary, for example an adjustment based on their
own productivity (see Table 2a). Roughly a quarter indicated
payment by fixed salary, and 20 percent received a share of practice revenue.
n 2008, 44 percent of physicians reported receiving some
form of performance-adjusted salary, for example an adjustment based on their
own productivity (see Table 2a). Roughly a quarter indicated
payment by fixed salary, and 20 percent received a share of practice revenue.
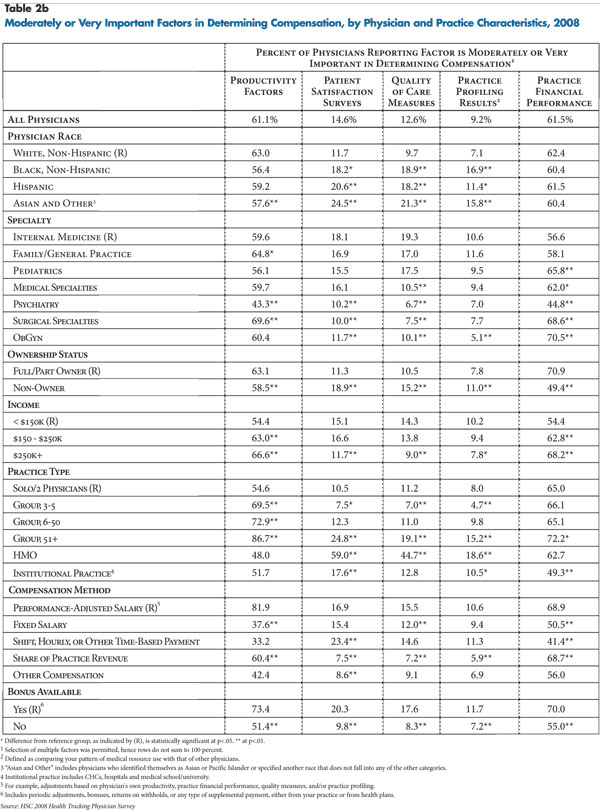
Productivity factors and overall practice financial performance were the most common financial incentives affecting physicians’ compensation (see Table 2b). About 61 percent of physicians reported these factors were moderately or very important in determining their compensation. In contrast, less than one in 10 physicians reported that results of practice profiling—how the physician’s resource use compares to other physicians—were moderately or very important in determining their compensation. Likewise, about one in eight physicians reported quality-of-care measures (13%) and one in seven reported patient satisfaction surveys (15%) were moderately or very important in determining their compensation.
Factors considered important in determining compensation varied across physician and practice characteristics. Productivity and practice financial performance tended to increase in importance as physician income increased, while quality measures, patient satisfaction and profiling diminished in importance. Across specialties, compensation of surgical specialists was more sensitive to productivity and financial performance and less sensitive to the remaining measures, relative to general internists. Among physicians in non-institutional practice settings, the influence of productivity measures increased with physician group size. Physicians working in group or staff-model HMOs cited patient satisfaction surveys, quality measures and practice profiling as more important incentives compared with physicians in solo or two-physician practices. Physicians eligible for bonuses tended to cite all factors as important to their compensation relative to those who were ineligible for bonuses.
Back to Top
Career Satisfaction
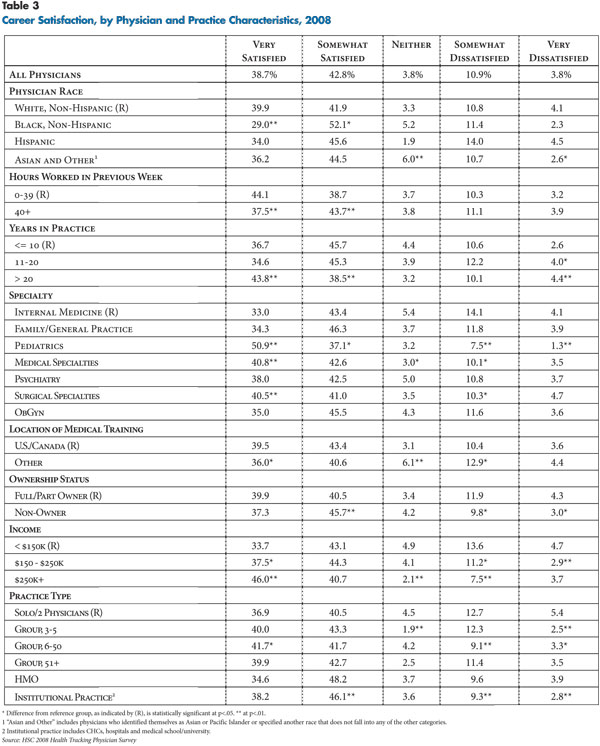
![]() orty-three percent of physicians stated that they were
“somewhat satisfied” with their overall medical career, and 39 percent were
“very satisfied” (see Table 3). Career satisfaction levels
tended to vary by physician and practice characteristics. Physicians in practice
for more than 20 years provided more extreme responses: they were more likely
to be either very satisfied or very dissatisfied relative to newer doctors.
Pediatricians and both medical and surgical specialists reported greater career
satisfaction than general internists, family practitioners, psychiatrists and
obstetrician/gynecologists. Physicians with higher incomes also reported greater
career satisfaction.
orty-three percent of physicians stated that they were
“somewhat satisfied” with their overall medical career, and 39 percent were
“very satisfied” (see Table 3). Career satisfaction levels
tended to vary by physician and practice characteristics. Physicians in practice
for more than 20 years provided more extreme responses: they were more likely
to be either very satisfied or very dissatisfied relative to newer doctors.
Pediatricians and both medical and surgical specialists reported greater career
satisfaction than general internists, family practitioners, psychiatrists and
obstetrician/gynecologists. Physicians with higher incomes also reported greater
career satisfaction.
Back to Top
Acceptance of New Patients
![]() n average, almost half of physicians’ practice revenue was derived from public sources—about 31 percent from Medicare and 17 percent from Medicaid.
n average, almost half of physicians’ practice revenue was derived from public sources—about 31 percent from Medicare and 17 percent from Medicaid.
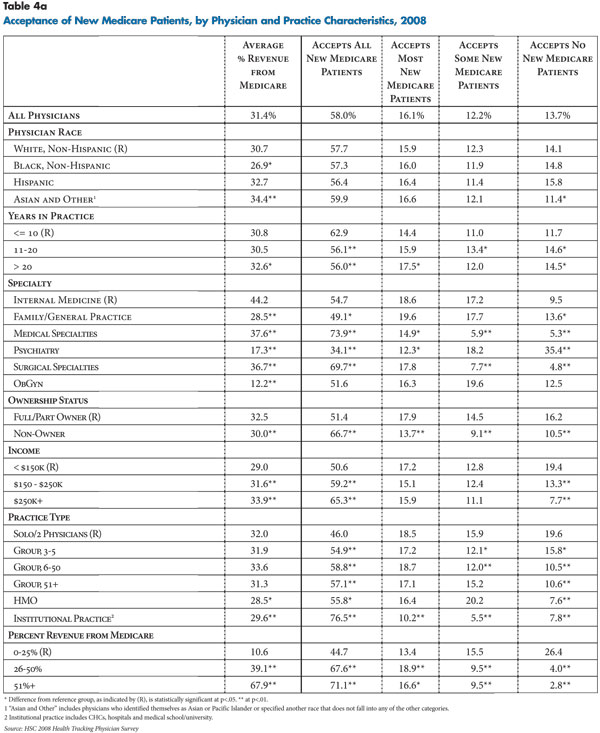
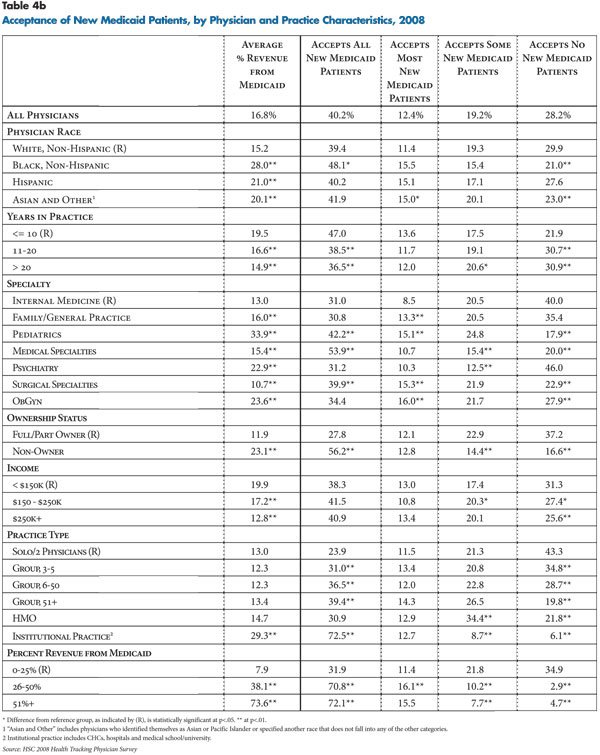
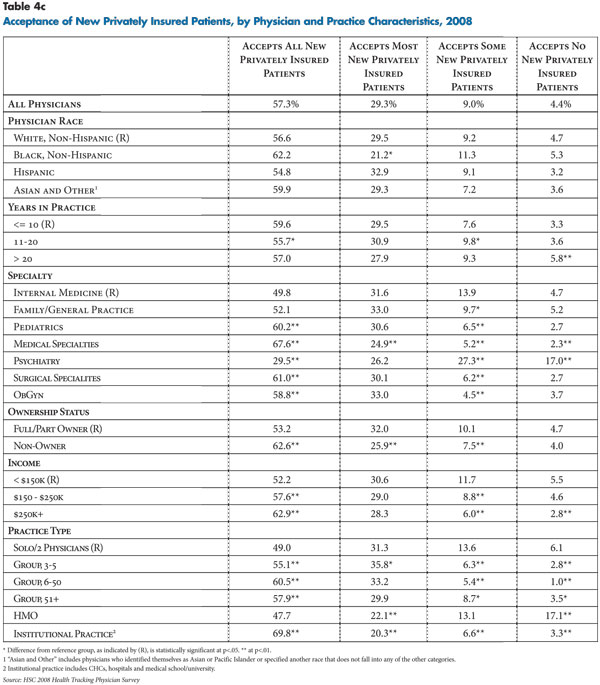
Practices’ acceptance of new patients varied by patient insurance type and physician and practice characteristics (see Tables 4a, 4b and 4c). Generally, practices were much less likely to accept new Medicaid patients than new Medicare or privately insured patients.
Slightly more than half of physicians (53%) reported their practices were accepting all or most new Medicaid patients; 28 percent reported accepting no new Medicaid patients. Almost nine in 10 physicians (87%) reported their practices were accepting all or most new privately insured patients, and almost three-quarters (74%) reported their practices accept all or most new Medicare patients.
Some patterns emerged related to physician and practice traits and acceptance of new patients. Black physicians were more likely to accept new Medicaid patients. Medical and surgical specialists were more likely to accept new patients regardless of insurance type, possibly because of the distinct episodic nature of the services they tend to provide—as opposed to primary care physicians who provide ongoing care across patients’ conditions. And, psychiatrists were much less likely to accept new patients regardless of insurance type. Group practices, especially those with six or more physicians, and institutional practices were more likely to accept new patients across the board. Likewise, physicians in rural areas reported their practices were more likely to accept new patients (findings not shown).
Back to Top
Managed Care Contracts
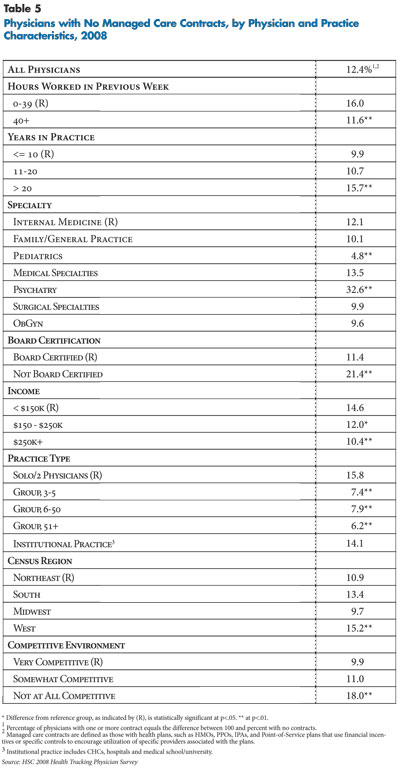
![]() espite anecdotal reports that many physicians have dropped
out of insurance networks, the vast majority of physicians (87.6%) had managed
care contracts in 2008 (see Table 5). Moreover, almost
70 percent reported they have five or more managed care contracts (findings
not shown).
espite anecdotal reports that many physicians have dropped
out of insurance networks, the vast majority of physicians (87.6%) had managed
care contracts in 2008 (see Table 5). Moreover, almost
70 percent reported they have five or more managed care contracts (findings
not shown).
Compared with physicians with one or more managed care contracts, physicians without managed care contracts were more likely to have practiced for more than 20 years, work fewer than 40 hours per week, lack board certification, work in solo or two-physician practices, live in the western United States and report practicing in a non-competitive environment.
Options for physicians who do not contract with managed care plans range from seeing only patients covered by insurance products that do not include provider networks (such as fee-for-service Medicare), establishing cash-only practices, and serving managed care patients as an out-of-network provider who can balance bill patients for charges beyond insurer allowances for out-of-network care.
Across specialties, psychiatrists were much less likely to have managed care contracts—about one-third did not have any managed care contracts—perhaps reflecting both low reimbursement rates and the burden of greater utilization management from health plans and managed behavioral health companies that many psychiatrists face. It also may reflect shortages of psychiatrists in many areas. In contrast, pediatricians are more likely to have managed care contracts—only 4.8 percent reported no managed care contracts—likely because Medicaid managed care plans represent a significant source of coverage for children.
Back to Top
Charity Care
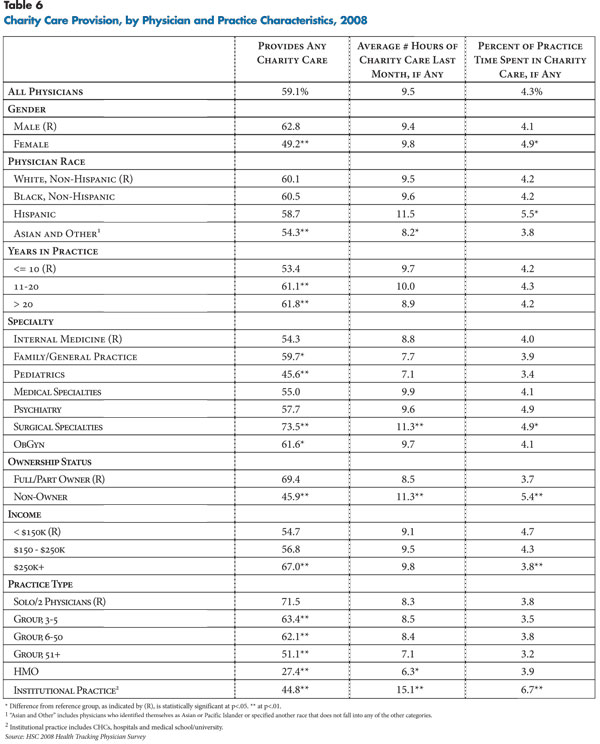
![]() n 2008, slightly fewer than six in 10 U.S. physicians (59.1%)
reported providing charity care—defined as free or reduced-cost care—to patients
in financial need (see Table 6).
n 2008, slightly fewer than six in 10 U.S. physicians (59.1%)
reported providing charity care—defined as free or reduced-cost care—to patients
in financial need (see Table 6).
On average, physicians who provided charity care provided 9.5 hours of charity care in the month preceding the survey, which amounts to slightly more than 4 percent of their time spent in all medically related activities.
Provision of charity care varied considerably across physician and practice characteristics. Surgical specialists (73.5%) were the most likely to provide charity care, probably because many are required to be on call at hospitals and encounter uninsured patients who need emergency services. Pediatricians (45.6%) were the least likely to provide charity care, perhaps reflecting the fact that fewer children are uninsured because of more generous public coverage eligibility.
Levels of charity care were highest among physicians in solo or two-physician practices (71.5%). By comparison, physicians in larger groups, HMOs and institutional practices—where charity care policies likely are set at the organizational level—were much less likely to provide charity care.
Physicians at the highest income levels reported the greatest provision of charity care: 67 percent of physicians with practice incomes exceeding $250,000 provided charity care in 2008, compared with 54.7 percent of physicians earning less than $150,000. Physicians providing charity care also were more likely to have been in practice for more than 10 years.
Back to Top
Click here to view this figure as a PowerPoint slide.
Click here to view this figure as a PowerPoint slide.
Click here to view this figure as a PowerPoint slide.
Click here to view this figure as a PowerPoint slide.
Click here to view this figure as a PowerPoint slide.
Click here to view this figure as a PowerPoint slide.
Click here to view this figure as a PowerPoint slide.
Click here to view this figure as a PowerPoint slide.
Click here to view this figure as a PowerPoint slide.
Click here to view this figure as a PowerPoint slide.
Click here to view this figure as a PowerPoint slide.
Click here to view this figure as a PowerPoint slide.
Notes
Funding Acknowledgement
The 2008 HSC Health Tracking Physician Survey and this research were funded by the Robert Wood Johnson Foundation.
Data Source
This Data Bulletin presents findings from the Center for Studying Health System Change (HSC) 2008 Health Tracking Physician Survey, a nationally representative mail survey of U.S. physicians providing at least 20 hours per week of direct patient care. The sample of physicians was drawn from the American Medical Association master file and included active, nonfederal, office- and hospital-based physicians. Residents and fellows were excluded, as well as radiologists, anesthesiologists and pathologists. The survey includes responses from more than 4,700 physicians, and the response rate was 62 percent. Estimates from this survey should not be compared to estimates from HSC’s previous Community Tracking Study (CTS) Physician Surveys because of changes in the survey administration mode from telephone to mail, question wording, skip patterns, sample structure and population represented. More detailed information on survey content and methodology can be found at www.hschange.org.