A Growing Hole in the Safety Net: Physician Charity Care Declines Again
Tracking Report No. 13
March 2006
Peter J. Cunningham, Jessica H. May
Continuing a decade-long trend, the proportion of U.S. physicians providing charity care dropped to 68 percent in 2004-05 from 76 percent in 1996-97, according to a national study from the Center for Studying Health System Change (HSC). The ongoing decline in physician charity care is alarming given the increase in the number of uninsured people, particularly during the first half of the decade. Declines in charity care were observed across most major specialties, practice types, practice income levels and geographic regions. Increasing financial pressures and changes in practice arrangements may account in part for the continuing decrease in physician charity care.
- Physician Charity Care Continues to Decline
- Physician Specialty
- Physician Practice Characteristics
- Physician Income
- Location of Charity Care
- Declines in Access to Medical Care
- Implications
- Notes
- Data Source
Physician Charity Care Continues to Decline
![]() hysicians have long played a key role in the nation’s
health care safety net, providing free or reduced cost care to uninsured patients
in their own practice or as volunteers at free clinics. However, financial and
time pressures, as well as ongoing changes in the medical marketplace, may be
contributing to decreases in the proportion of physicians providing charity
care. The percentage of physicians providing any free or reduced cost care decreased
to 68.2 percent in 2004-05 from 71.5 percent in 2000-01, according to HSC’s
nationally representative Community Tracking Study Physician Survey (see Data
Source). This trend dates back to at least 1996-97, when more than three-fourths
(76.3%) of physicians provided some charity care (see Figure
1 and Table 1).
hysicians have long played a key role in the nation’s
health care safety net, providing free or reduced cost care to uninsured patients
in their own practice or as volunteers at free clinics. However, financial and
time pressures, as well as ongoing changes in the medical marketplace, may be
contributing to decreases in the proportion of physicians providing charity
care. The percentage of physicians providing any free or reduced cost care decreased
to 68.2 percent in 2004-05 from 71.5 percent in 2000-01, according to HSC’s
nationally representative Community Tracking Study Physician Survey (see Data
Source). This trend dates back to at least 1996-97, when more than three-fourths
(76.3%) of physicians provided some charity care (see Figure
1 and Table 1).
Despite a decrease in the proportion of physicians providing charity care, the actual number of physicians providing charity care has remained relatively stable because the overall number of practicing U.S. physicians increased from approximately 347,000 in 1996-97 to 397,000 in 2004-05. Additionally, among physicians who provide charity care, there was little change in the amount of charity care provided during this period. From 1996-97 to 2004-05, the average number of hours spent providing charity care and the percentage of practice time spent on charity care both declined slightly, but these changes were not statistically significant.
Nevertheless, there has been a decline in the amount of physician charity care relative to the number of uninsured Americans. The overall number of charity care hours per 100 uninsured people declined from 7.7 hours in 1996-97 to 6.3 in 2004-05, an 18 percent decline.1 Most of this decrease has occurred since 2000-01, primarily because of large increases in the number of uninsured, from 39.6 million in 2000 to 45.5 million in 2004.
Back to Top
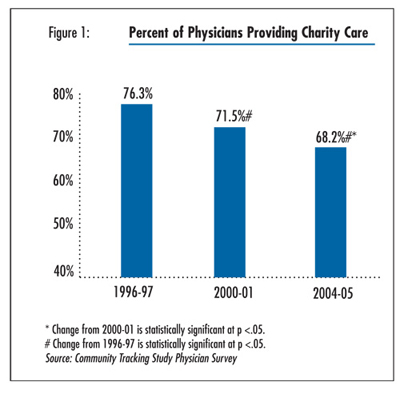
Table 1
|
|
1996-97
|
2000-01
|
2004-05
|
|
| Number of U.S. Physicians (thousands) |
347
|
379
|
397
|
| Percent of Physicians Providing Any Charity Care in Previous Month |
76.3
|
71.5#
|
68.2*#
|
| Average Number of Hours Providing Charity Care, if Any |
11.1
|
11.0
|
10.6
|
| Percent of Practice Time Spent on Charity Care, if Any |
6.7
|
6.5
|
6.3
|
| * Change from 2000-01 is statistically significant at p <.05. # Change from 1996-97 is statistically significant at p <.05. Source: Community Tracking Study Physician Survey |
|||
Physician Specialty
![]() he proportion of physicians providing charity care declined
across all major specialty groups (see Table 2), as well
as across all geographic regions and in both urban and rural areas (latter findings
not shown). Surgical specialists are the most likely among specialty physicians
to provide charity care, probably because many are required to be on call at
hospitals and therefore have less choice about whether to treat uninsured patients.
Pediatricians are the least likely to provide charity care, which perhaps reflects
the fact that fewer children are uninsured because of more generous public coverage
eligibility compared with adults.
he proportion of physicians providing charity care declined
across all major specialty groups (see Table 2), as well
as across all geographic regions and in both urban and rural areas (latter findings
not shown). Surgical specialists are the most likely among specialty physicians
to provide charity care, probably because many are required to be on call at
hospitals and therefore have less choice about whether to treat uninsured patients.
Pediatricians are the least likely to provide charity care, which perhaps reflects
the fact that fewer children are uninsured because of more generous public coverage
eligibility compared with adults.
Back to Top
Table 2
|
|
1996-97
|
2000-01
|
2004-05
|
||
| All Physicians |
76.3%
|
71.5%#
|
68.2%#*
|
|
| Specialty | ||||
| General Internal Medicine |
71.2
|
67.0*
|
67.2
|
|
| Family/General Practice |
77.0
|
74.6
|
66.7#*
|
|
| General Pediatrics |
65.1
|
65.1
|
60.5
|
|
| Medical Specialist |
74.8
|
66.8#
|
63.7#*
|
|
| Surgical Specialist |
83.1
|
80.9
|
78.8#
|
|
| Practice Type | ||||
| Solo/Two Physicians |
83.9
|
80.6#
|
81.8
|
|
| Small Group Practice |
81.2
|
79.8
|
78.5
|
|
| Group—11-50 Physicians |
76.5
|
71.3#
|
66.2#
|
|
| Group—50+ Physicians |
73.3
|
67.5
|
61.9#
|
|
| Group/Staff HMO |
45.1
|
39.9
|
35.8
|
|
| Medical School |
74.1
|
63.8#
|
54.6#*
|
|
| Hospital |
66.3
|
59.4#
|
54.5#
|
|
| Other |
64.0
|
62.1
|
54.4#*
|
|
| Ownership | ||||
| Full or Part Owner |
83.0
|
80.5#
|
78.2#*
|
|
| Non-Owner |
65.6
|
60.2#
|
56.4#*
|
|
| Physician Income in Year Prior to the Interview | ||||
| < $120,000 |
72.6
|
68.6#
|
66.4#
|
|
| $120,000-$250,000 |
74.7
|
68.7#
|
65.0#*
|
|
| > $250,000 |
82.6
|
80.7
|
75.6#*
|
|
| * Change from 2000-01 is statistically significant at p <.05. # Change from 1996-97 is statistically significant at p <.05. Source: Community Tracking Study Physician Survey |
||||
Physician Practice Characteristics
![]() harity care is declining across most types of physician practices,
and physicians are increasingly moving to practice settings where there is less
provision of charity care.
harity care is declining across most types of physician practices,
and physicians are increasingly moving to practice settings where there is less
provision of charity care.
Levels of charity care are highest among physicians in solo or small group practices and those that are full or part owners of their own practice, perhaps because they have greater control over the types of patients they see and there are fewer organizational barriers for uninsured persons to see these physicians. About 80 percent of physicians in solo practice or small groups (10 physicians or fewer) provided charity care in 2004-05, and this has not changed significantly since 1996-97.
By comparison, physicians in larger groups and institutional-based practices (i.e. medical schools or hospitals) are much less likely to provide charity care, and charity care among these physicians declined sharply between 1996-97 and 2004-05. Furthermore, a decreasing number of physicians are in solo practice, and an increasing number of physicians are practicing in the practice settings that are less likely to provide charity care. Between 1996-97 and 2004-05, the percentage of physicians in solo or two-physician practices declined from 40 percent to 31 percent, while the percentage in large groups, hospitals, and medical schools increased from 21 percent to 26 percent (findings not shown).
Similarly, physicians who own their practice are more likely to provide charity care than nonowners (who are more likely to be in large practices and institutional settings). While charity care decreased between 1996-97 and 2004-05 for both owners and nonowners, the percentage of physicians who are full or part owners has been steadily decreasing, from about 62 percent in 1996-97 to 54 percent in 2004-05.
Back to Top
Physician Income
![]() rovision of charity care has declined for physicians at
all levels of income. Physicians at the highest income levels continue to report
the greatest provision of charity care, with 75.6 percent of physicians with
practice incomes greater than $250,000 providing charity care in 2004-05, compared
with 66.4 percent of physicians earning less than $120,000. However, physician
income has declined in real terms in recent years, both for primary care physicians
and specialists, likely because of constraints on public and private reimbursement
levels.2 Declining practice incomes likely make it more
difficult for physicians to subsidize charity care.
rovision of charity care has declined for physicians at
all levels of income. Physicians at the highest income levels continue to report
the greatest provision of charity care, with 75.6 percent of physicians with
practice incomes greater than $250,000 providing charity care in 2004-05, compared
with 66.4 percent of physicians earning less than $120,000. However, physician
income has declined in real terms in recent years, both for primary care physicians
and specialists, likely because of constraints on public and private reimbursement
levels.2 Declining practice incomes likely make it more
difficult for physicians to subsidize charity care.
Back to Top
Location of Charity Care
![]() he majority of physicians who provided charity care (more
than 70%) reported that they typically did so in their own practice (see Table
3). About 14 percent of physicians reported providing charity care primarily
while on call in a hospital emergency department, about 6 percent in another
practice or clinic (e.g. as volunteers at a free care clinic), and 8.4 percent
at another unspecified location.
he majority of physicians who provided charity care (more
than 70%) reported that they typically did so in their own practice (see Table
3). About 14 percent of physicians reported providing charity care primarily
while on call in a hospital emergency department, about 6 percent in another
practice or clinic (e.g. as volunteers at a free care clinic), and 8.4 percent
at another unspecified location.
Pediatricians and family practice physicians are the most likely among major specialty groups to provide charity care at their main practice. Medical and surgical specialists are the most likely to provide charity care as a result of their on-call responsibilities at hospitals, although most specialists report that their own practice is the place where they typically provide charity care.
Back to Top
Table 3
|
|
In Own Practice
|
On-Call at Hospital ED
|
Other Practice or Clinic
|
Other
|
|
| All Physicians Who Provide Charity Care |
71.2%
|
13.9%
|
6.4%
|
8.4%
|
| Specialty | ||||
| General Internal Medicine |
73.2
|
13.6
|
4.3
|
9.0
|
| Family Practice |
80.8
|
3.9
|
7.1
|
8.3
|
| Pediatrician |
85.9
|
2.8
|
4.4
|
6.9
|
| Medical Specialists |
66.7
|
14.5
|
6.9
|
11.9
|
| Surgical Specialists |
67.0
|
21.7
|
7.0
|
4.4
|
| Source: Community Tracking Study Physician Survey | ||||
Declines in Access to Medical Care
![]() he long-term decline in charity care provided by physicians
may have contributed to reductions in uninsured people’s access to medical
care. In 2003, 63.1 percent of the uninsured had a regular source of medical
care, down from 68.6 percent in 1996-97 (see Table 4).
Additionally, the percentage of the uninsured with a physician visit in the
past year fell from 51.6 percent to 46.1 percent during this period.
he long-term decline in charity care provided by physicians
may have contributed to reductions in uninsured people’s access to medical
care. In 2003, 63.1 percent of the uninsured had a regular source of medical
care, down from 68.6 percent in 1996-97 (see Table 4).
Additionally, the percentage of the uninsured with a physician visit in the
past year fell from 51.6 percent to 46.1 percent during this period.
Emergency department visits as a proportion of all ambulatory visits increased for the uninsured between 1996-97 and 2000-01, as did the proportion of uninsured people with unmet medical needs. However, the downward trend in access leveled off between 2000-01 and 2003, and even improved in terms of unmet medical needs. Continued declines in physician charity care during the early 2000s may have been offset to some extent by the strengthening of the safety net in some communities, especially the expansion of federally supported community health centers.3
Back to Top
Table 4
|
|
1996-97
|
2000-01
|
2003
|
|
| Regular Source of Medical Care |
68.6%
|
64.1%#
|
63.1%#
|
| Physician Visit |
51.6
|
46.6#
|
46.1#
|
| Emergency Department Visits as a Percentage of Amulatory Care Visits |
18.7
|
22.1#
|
20.7
|
| Unmet Medical Need |
13.5
|
15.0#
|
13.2*
|
| * Change from 2000-01 is statistically significant at p <.05. # Change from 1996-97 is statistically significant at p <.05. Source: Community Tracking Study Household Survey |
|||
Implications
![]() hysicians and hospitals historically have provided charity care to
the uninsured in part by charging higher fees to other patients, particularly
those with private insurance coverage. But both public and private payers have
held the line on reimbursements to medical providers, creating financial pressures
that may be limiting physicians’ ability to provide charity care.
hysicians and hospitals historically have provided charity care to
the uninsured in part by charging higher fees to other patients, particularly
those with private insurance coverage. But both public and private payers have
held the line on reimbursements to medical providers, creating financial pressures
that may be limiting physicians’ ability to provide charity care.
Hospital uncompensated care levels have held steady in recent years, aided by hospitals’ private insurance payments rising somewhat faster than costs.4 However, declining practice incomes among physicians suggest that they have been less successful than hospitals in negotiating fees with private payers, and they also have experienced continued constraints from public payers. Time pressures for physicians also have increased, in part because of a strong surge in demand for physician services during the late-1990s.5 As a result, the decline in charity care between 1996-97 and 2004-05 may reflect physicians who believe they can no longer afford or have time to provide charity care.
The movement toward larger practice arrangements and less ownership is also contributing to a decrease in charity care, although this shift may be a response in part to financial and time pressures that physicians are experiencing. Larger practices in which physicians are employees can help shield them from these pressures, provide more leverage in negotiating fees with private payers, and relieve them from some of the burden of on-call responsibilities. However, larger practices also may present greater organizational barriers to uninsured patients, and employed physicians have less discretion over the types of patients they see.
The result is that the uninsured likely must rely even more on formal safety net providers, such as community health centers, other free clinics and public hospitals; or they are getting less medical care. This also implies a shift in the financial burden of providing care to the uninsured from physicians to taxpayers in the form of direct and indirect subsidies to major safety net providers. The expansion of federally supported community health centers in recent years may have helped to stem the decline in access to care among the uninsured that was observed during the late-1990s, although overall federal spending on the safety net—while increasing—has not kept pace with the growing number of uninsured.6 Unless there are steps taken to halt and even reverse increases in the number of uninsured, it is likely that safety net resources will become even more constrained as a result of increased demand.
Back to Top
Notes
Back to Top
Data Source
This Tracking Report presents findings primarily from the HSC Community Tracking Study Physician Survey, a nationally representative telephone survey of physicians involved in direct patient care in the continental United States conducted in 1996-97, 1998-99 (results not shown for ease of presentation), 2000-01 and 2004-05. The sample of physicians was drawn from the American Medical Association and the American Osteopathic Association master files and included active, nonfederal, office- and hospital-based physicians who spent at least 20 hours a week in direct patient care. Residents and fellows were excluded. The 1996-97, 1998-99 and 2000-01 surveys each contain information on about 12,000 physicians, while the 2004-05 survey includes responses from more than 6,600 physicians. The response rates ranged from 52 percent to 65 percent.
In addition, this Tracking Report presents findings from the HSC Community
Tracking Study Household Survey, a nationally representative telephone survey
of the civilian, noninstitutionalized population. Data were supplemented by
in-person interviews of households without telephones to ensure proper representation.
The 1996-97 and 2000-01 surveys each contain information on about 60,000 persons,
while the 2003 survey includes responses from about 46,600 persons. The response
rates ranged from 57 percent to 60 percent. More detailed information on survey
methodology can be found at www.hschange.org.
Back to Top
ISSUE BRIEFS are published by the
Center for Studying Health System Change.
600 Maryland Avenue, SW, Suite 550
Washington, DC 20024-2512
Tel: (202) 484-5261
Fax: (202) 484-9258
www.hschange.org
Vice President: Jon Gabel