
Trends in U.S. Health Insurance Coverage, 2001-2003
Tracking Report No. 9
August 2004
Bradley C. Strunk, James D. Reschovsky
| Errata: An error was found in Tracking Report No. 9, Trends in U.S. Health Insurance Coverage, 2001-2003, after the report’s release. On page three of the report and in Supplementary Table 2 we reported estimates of employer-sponsored insurance take-up rates as occurring at the person level. The take-up estimates in the report and table actually reflect take-up rates at the family level. Take up at the family level is defined as follows: If anyone in the family accepts an offer of health insurance from an employer, then all members of that family are counted as having taken up for the purpose of calculating a family-level take up rate. The online documents were corrected to reflect the change on Sept. 9, 2004. |
Against the backdrop of a sluggish economy and rapidly rising health insurance premiums, the proportion of Americans under age 65 covered by employer-sponsored insurance fell dramatically from 67 percent to 63 percent between 2001 and 2003. Although the decline in employer coverage could have spurred a large increase in the uninsured, the proportion of Americans without health insurance did not increase significantly, according to findings from the Center for Studying Health System Change’s (HSC) Community Tracking Study Household Survey. Expansion of public health insurance—including Medicaid and the State Children’s Health Insurance Program (SCHIP)—forestalled a significant increase in the uninsured, as the proportion of the under-65 population enrolled in public coverage increased from 9 percent to 12 percent.
- Public Insurance Coverage Gain Offsets Significant Employer Coverage Decline
- How Coverage Changed
- Employer Coverage Decline
- Public Insurance as Safety Net
- Implications
- Supplementary Tables
- Notes
- Data Source
Public Insurance Coverage Gain Offsets Significant Employer Coverage Decline
![]() s the U.S. economy struggled during the 2001 economic
recession and less-than-robust job growth during the recovery,
concerns escalated about the potential for a significant increase
in the number of Americans without health insurance. Rapidly
rising health care costs and soaring insurance premiums—which
make health insurance increasingly unaffordable—compounded
these concerns.
s the U.S. economy struggled during the 2001 economic
recession and less-than-robust job growth during the recovery,
concerns escalated about the potential for a significant increase
in the number of Americans without health insurance. Rapidly
rising health care costs and soaring insurance premiums—which
make health insurance increasingly unaffordable—compounded
these concerns.
The economic downturn did spark a significant decline in employer coverage—the primary way people under age 65 obtain health insurance. After increasing during the last few years of the 1990s, the proportion of the under-65 population with employer coverage fell from 67 percent in 2001 to 63.4 percent in 2003 (see Table 1). After adjusting for the effect of population growth, this translates into 8.9 million fewer people covered by employer-sponsored insurance than would have been the case if coverage rates remained unchanged.
The decline in employer coverage, however, was not accompanied by a large increase in the overall proportion of Americans who are uninsured. The proportion of Americans under age 65 that lack health insurance increased slightly between 2001 and 2003—from 14.1 percent to 15 percent—but the change was not quite statistically significant. Instead, many of the people who lost employer coverage appear to have moved to public coverage, as the proportion of the under-65 population with Medicaid, SCHIP and other state coverage increased significantly from 8.9 percent in 2001 to 11.9 percent in 2003.
Back to Top
Table 1
Coverage Trends for Nonelderly Americans
| Source of Coverage |
1997
|
1999
|
2001
|
2003
|
| Employer |
65.1%
|
66.0%
|
67.0%
|
63.4*#
|
| Other Private |
6.9
|
6.7
|
6.0*
|
5.5#
|
| Public Insurance |
7.6
|
8.3*
|
8.9
|
11.9*#
|
| Other Coverage |
4.9
|
4.0*
|
3.9
|
4.2#
|
| Uninsured |
15.4
|
15.1
|
14.1*
|
15.0
|
| Notes: Other private includes private nongroup insurance
and private insurance obtained through someone outside the family. Public
includes Medicaid, SCHIP and other state programs but not Medicare. Other
coverage includes Medicare, military insurance, Indian Health Service and
miscellaneous other coverage. * Change from previous round is statistically significant at p <.05. # Change from 1997-2003 is statistically significant at p <.05. Source: HSC Community Tracking Study Household Survey |
||||
How Coverage Changed
![]() eclines in employer coverage and offsetting growth in public
insurance enrollment were widespread across the nonelderly
population. But various groups experienced extremely different
trends in health coverage (see Supplementary Table 1).
eclines in employer coverage and offsetting growth in public
insurance enrollment were widespread across the nonelderly
population. But various groups experienced extremely different
trends in health coverage (see Supplementary Table 1).
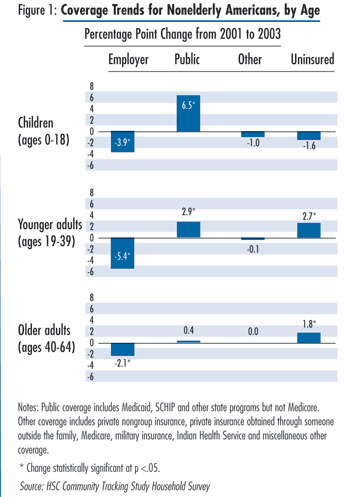
Age. All age groups saw a decline in employer coverage, but changes were particularly pronounced for young adults 19 to 39 and children 18 and under. Between 2001 and 2003, the proportion of young adults with employer coverage declined from 64.9 percent to 59.4 percent (see Figure 1). About half of the decline in employer coverage among young adults was offset by growth in public insurance enrollment from 5.5 percent to 8.3 percent between 2001 and 2003. At the same time, however, the rate of uninsured young adults increased from 21.2 percent to 23.8 percent.
Among children, employer coverage declined from 63.4 percent to 59.5 percent. But children saw a large increase in public insurance enrollment, which grew from 17.6 percent in 2001 to 24.1 percent in 2003. Employer coverage of adults 40 to 64 declined from 72.5 percent in 2001 to 70.3 percent in 2003, almost mirroring the increase in the proportion of uninsured in this age group from 11.4 percent in 2001 to 13.2 percent in 2003.
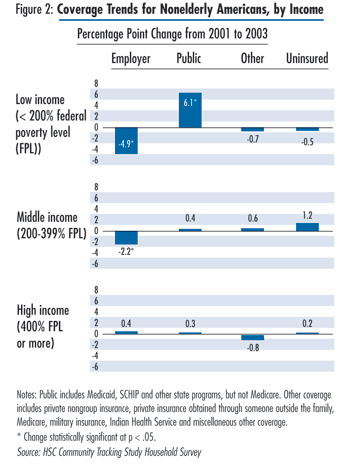
Income. Changes in insurance coverage between 2001 and 2003 were concentrated among low-income people. Among the under-65 population with family income less than 200 percent of the federal poverty level (FPL)—$36,800 for a family of four in 2003-the proportion with employer coverage declined from 37.4 percent to 32.5 percent (see Figure 2). Gains in public insurance enrollment offset the large decline, as the proportion of the low-income population in Medicaid or SCHIP grew from 23.5 percent in 2001 to 29.6 percent in 2003. Middle-income individuals—those with family income between 200 and 399 percent of poverty—experienced a smaller decline in employer coverage from 74.4 percent in 2001 to 72.2 percent in 2003.
While trends by income partly reflect changes within income groups, they also reflect shifts of the under-65 population from higher-income to lower-income groups. The proportion of the under-65 population with low incomes rose from 29.5 percent to 33.1 percent between 2001 and 2003.
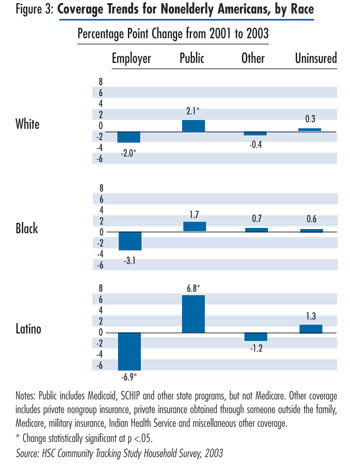
Race. Among the under-65 population of major ethnic and racial groups, Latinos were the least likely to have employer coverage and the most likely to be uninsured. Changes in insurance coverage between 2001 and 2003 were particularly pronounced as employer coverage for Latinos declined from 46.7 percent to 39.7 (see Figure 3). During the same period, public insurance enrollment among Latinos increased from 15.3 percent to 22.1 percent. Whites also experienced offsetting changes in employer coverage and public insurance program enrollment, with employer coverage declining from 73.3 percent to 71.3 percent as public coverage increased from 5.7 percent to 7.9 percent for whites between 2001 and 2003. Trends for blacks were not statistically significant: 51.3 percent of blacks in 2003 had employer coverage, 21.5 percent had public coverage and 17.9 percent were uninsured.
Back to Top
Employer Coverage Decline
![]() he drop in employer coverage between 2001 and 2003 was
largely because of a decline in the likelihood of people being
in a working family and, among those in a working family,
less access to employer coverage (see Supplementary Table 2).
Because of the recession, there was a notable drop in the proportion
of the population in a family with at least one worker: 84.2
percent of the under-65 population was in a working family in
2001 compared with 81.4 percent in 2003, and the decline was
concentrated among young adults and children.
he drop in employer coverage between 2001 and 2003 was
largely because of a decline in the likelihood of people being
in a working family and, among those in a working family,
less access to employer coverage (see Supplementary Table 2).
Because of the recession, there was a notable drop in the proportion
of the population in a family with at least one worker: 84.2
percent of the under-65 population was in a working family in
2001 compared with 81.4 percent in 2003, and the decline was
concentrated among young adults and children.
In addition, access to employer coverage—an offer of coverage through one’s own or a family member’s employer and eligibility for that coverage—declined between 2001 and 2003. The proportion of the under-65 population in working families with access to employer coverage fell from 80.4 percent to 78.2 percent. The drop in access was particularly dramatic for low-income people: The proportion of this group with access declined from 62.7 percent to 55.4 percent.
Changes in access were likely the result of two factors. First, among people who remained in a family with at least one worker, the number of full-time workers declined. With fewer full-time workers, families are less likely to have access to an employer that offers health insurance. Second, employ- ers became slightly less likely to offer health insurance to their employees.
Despite rising health insurance premiums and a recent trend among employers to shift costs to their employees by increasing patient cost sharing, take up of employer coverage at the family level held fairly steady from 2001 to 2003. The proportion of people in working families where at least one member of the family accepted an offer of employer coverage declined from 93.3 percent in 2001 to 92.4 percent in 2003, but the change was not statistically significant. Young adults, however, experienced a significant change: The take-up rate among this group declined from 91.4 percent in 2001 to 89.8 percent in 2003.
Back to Top
Public Insurance as Safety Net
![]() ublic insurance clearly picked up the slack as the United Sates
moved through a recession and jobless recovery and employer
coverage declined. SCHIP, enacted in 1997, played a major role
and has been remarkably successful in providing a safety net to
children who otherwise might be uninsured.
ublic insurance clearly picked up the slack as the United Sates
moved through a recession and jobless recovery and employer
coverage declined. SCHIP, enacted in 1997, played a major role
and has been remarkably successful in providing a safety net to
children who otherwise might be uninsured.
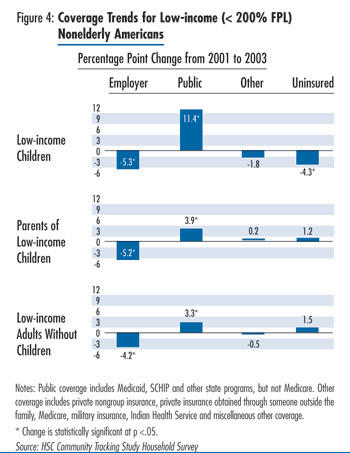
By far, low-income children experienced the largest gains in public insurance enrollment. Between 2001 and 2003, the proportion of low-income children enrolled in public insurance grew from 37.9 percent to 49.3 percent (see Figure 4), representing an increase of almost 5 million children.
Growth in public coverage enrollment was accompanied by a sizable, though smaller, decline in the uninsurance rate among low-income children, which fell by 4.3 percentage points to 11.4 percent in 2003. At the same time, the proportion of low-income children with employer coverage declined by 5.3 percentage points to 31.9 percent in 2003. Therefore, while some of the large increase in public coverage among low-income children may have resulted from state eligibility expansions and outreach efforts, the increase in public coverage also was fueled by parents losing employer coverage or choosing to substitute public coverage for their children’s employer coverage.
Both the parents of low-income children and low-income adults without children experienced significant increases in public insurance enrollment, although the changes were not nearly as dramatic as for low-income children. Among parents of low-income children, public insurance enrollment grew by 3.9 percentage points to 17.5 percent in 2003. Although most of this increase is likely attributable to the economic downturn, recent program expansions in several states, such as New Jersey and New York, which extended coverage to parents of children enrolled in SCHIP, also may have contributed.
Among low-income, childless adults, public insurance enrollment grew by 3.3 percentage points to 18.3 percent in 2003. In contrast to the trends for low-income children, the changes among adults were offset almost entirely by declines in employer coverage, which may be the result of changes in work status or access but also may reflect substitution of public coverage for employer coverage.
Back to Top
Implications
![]() efore the 2001 recession, many expressed concerns that the
employer-sponsored health insurance system in America was
weakening. Despite robust economic growth during much of the
1990s, the proportion of the population covered by employersponsored
insurance rose only modestly in the late 1990s. The
recession and tepid recovery significantly reduced the number of
people with employer coverage, more than reversing the modest
gains made during the economic growth in the late 1990s. While
the economic downturn reduced employment and accounted for
much of the decline in employer coverage, the rapidly rising cost
of health insurance, which increased about 28 percent between
2001 and 2003, likely contributed to the decline as well.
efore the 2001 recession, many expressed concerns that the
employer-sponsored health insurance system in America was
weakening. Despite robust economic growth during much of the
1990s, the proportion of the population covered by employersponsored
insurance rose only modestly in the late 1990s. The
recession and tepid recovery significantly reduced the number of
people with employer coverage, more than reversing the modest
gains made during the economic growth in the late 1990s. While
the economic downturn reduced employment and accounted for
much of the decline in employer coverage, the rapidly rising cost
of health insurance, which increased about 28 percent between
2001 and 2003, likely contributed to the decline as well.
Public health insurance has long served as a counter-cyclical tool, providing a safety net for many people affected by economic downturns. Although Medicaid’s role as a counter-cyclical tool may have weakened as a result of the Personal Responsibility and Work Opportunity Reconciliation Act of 1996—which delinked Medicaid from welfare support—SCHIP significantly expanded public coverage for children, an expansion that accelerated between 2001 and 2003. Indeed, uninsurance rates actually fell among low-income children, and growth of public coverage moderated growth of uninsurance among adults to about 2 percentage points, indicating public insurance worked as a counter-cyclical tool.
The American economy is now showing signs of a stronger recovery, with about 1 million new jobs created between March and June 2004. If this growth continues, it will likely begin to reverse the decline in employer coverage. At the same time, public insurance is threatened. The economic downturn resulted in severe state budget problems, leading some to freeze public coverage enrollment and others to cut eligibility, make enrollment and re-enrollment more difficult, and suspend outreach. Since many of these policy changes were not enacted until late 2003, the greatest impact on enrollment will likely occur in 2004.1 Moreover, federal legislation enacted in May 2003 that temporarily increased the federal matching rate for Medicaid expired on June 30, 2004. In the short term, it remains to be seen whether employment growth can prevent a sizable increase in the number of uninsured as people lose public insurance because of state cuts.
Even if the employer-sponsored insurance system can reabsorb those who lose public insurance, there is little reason to believe employer coverage will expand and drive a substantial decline in the uninsured in the longer term. Health care costs—and health insurance premiums—continue to outpace workers’ incomes by a large margin.2 Such rapid growth will continue to strain employers and make private health insurance less and less affordable. In the absence of major policy changes targeted at controlling health care costs or increasing insurance coverage, the long-term trends of declining employer coverage and increasing uninsurance will likely continue.
Back to Top
Supplementary Tables
The following supplementary tables for this Tracking Report are available in PDF format:
Table 1: Coverage
Trends by Age, Income and Race/Ethnicity, 2001-2003
Table 2: Family Work
Status and Employer-Sponsored Insurance Access and Take-up Rates
Notes
Back to Top
Data Source
This Tracking Report presents findings from the HSC Community Tracking Study (CTS) Household Survey, a nationally representative telephone survey of the civilian, noninstitutionalized population conducted in 1996-97, 1998-99, 2000-01 and 2003. For discussion and presentation, we refer to a single calendar year of the first three surveys (1997, 1999 and 2001). Data were supplemented by in-person interviews of households without telephones to ensure proper representation. The first three rounds of the survey contain information on about 60,000 people, while the 2003 survey contains responses from about 47,000 people. Response rates ranged from 60 percent to 65 percent for the first three rounds and 57 percent in 2003. The estimates in this report are representative of people under age 65. Insurance status reflects coverage on the day of the interview.
Back to Top
ISSUE BRIEFS are published by the
Center for Studying Health System Change.
600 Maryland Avenue, SW, Suite 550
Washington, DC 20024-2512
Tel: (202) 484-5261
Fax: (202) 484-9258
www.hschange.org
Vice President: Len M. Nichols