
Insured Americans Drive Surge in Emergency Department Visits
Issue Brief No. 70
October 2003
Peter J. Cunningham, Jessica H. May
![]() isits to hospital emergency departments (EDs) have increased
greatly in recent years, contributing to crowded conditions and ambulance diversions.1
Contrary to the popular belief that uninsured people are the major cause of
increased emergency department use, insured Americans accounted for most of
the 16 percent increase in visits between 1996-97 and 2000-01, according to
a study by the Center for Studying Health System Change (HSC). This Issue Brief
examines trends in emergency department and other ambulatory care use, focusing
on differences among insurance groups. Although insured people accounted for
most of the increase in emergency department visits, uninsured Americans increasingly
rely on emergency departments because of decreased access to other sources of
primary medical care. Emergency department waiting times also have increased
substantially, which may lower both insured and uninsured patients’ perceptions
of the quality of their care.
isits to hospital emergency departments (EDs) have increased
greatly in recent years, contributing to crowded conditions and ambulance diversions.1
Contrary to the popular belief that uninsured people are the major cause of
increased emergency department use, insured Americans accounted for most of
the 16 percent increase in visits between 1996-97 and 2000-01, according to
a study by the Center for Studying Health System Change (HSC). This Issue Brief
examines trends in emergency department and other ambulatory care use, focusing
on differences among insurance groups. Although insured people accounted for
most of the increase in emergency department visits, uninsured Americans increasingly
rely on emergency departments because of decreased access to other sources of
primary medical care. Emergency department waiting times also have increased
substantially, which may lower both insured and uninsured patients’ perceptions
of the quality of their care.
- Trends in Emergency Department Use
- Other Ambulatory Care Trends for Insured, Uninsured
- Nonurgent Visits Dominate ED Trips
- Trends in Waiting Times and Perceptions of Quality
- Longer Waits Mean Lower Perceptions of Quality
- Implications
- Data Source
- Notes
- Supplemental Tables
Trends in Emergency Department Use
![]() ata from the National Hospital Ambulatory Medical Care Survey (see
Data Sources) show an average of 108 million hospital emergency department visits
annually in 2000 and 2001, an increase of about 16 percent from 1996-97 (see
Table 1). Most of the increase—75 percent—was due to increased per person use-from
35 visits per 100 persons in 1996-97 to 39 visits in 2000-01. About one-fourth
of the increase in ED visits was due to general population increase.
ata from the National Hospital Ambulatory Medical Care Survey (see
Data Sources) show an average of 108 million hospital emergency department visits
annually in 2000 and 2001, an increase of about 16 percent from 1996-97 (see
Table 1). Most of the increase—75 percent—was due to increased per person use-from
35 visits per 100 persons in 1996-97 to 39 visits in 2000-01. About one-fourth
of the increase in ED visits was due to general population increase.
Contrary to the perception that the uninsured account for a disproportionate amount of the increase in emergency department use, most of the increase in visits is due to increased use by insured people, especially the privately insured. Emergency department visits by privately insured persons increased 24 percent between 1996-97 and 2000-01, far outpacing the 4.7 percent increase in the number of privately insured people during this period. Medicare beneficiaries’ ED use increased at a slower rate—10 percent—but was still higher than the 4.1 percent growth in the number of Medicare beneficiaries.
Together, privately insured and Medicare beneficiaries accounted for about two-thirds of the overall increase in emergency department visits, with increased use by privately insured people alone accounting for more than half of the total increase. On the other hand, the number of ED visits by Medicaid beneficiaries did not change between 1996-97 and 2000-01, despite a 10 percent increase in program enrollment.
Emergency department visits by self-pay or no-charge—uninsured—patients also increased by about 10 percent between 1996-97 and 2000-01, despite little change in the number of uninsured. Although ED use per uninsured person increased and is comparable to that for insured persons—about 40 visits per 100 persons in 2000-01-the uninsured accounted for far less of the overall increase in ED visits—11 percent—primarily due to their smaller numbers.2
Nevertheless, the increase in visits by uninsured patients could have serious implications for crowding in public hospitals and other safety net institutions that treat a disproportionately high number of uninsured patients.
Back to Top
| Table 1 Changes in Emergency Department Visits, 1996-97 to 2000-01 |
|||
|
Total Annual Visits, 2000 and 2001 (Thousands)
|
Change in Visits, 1996-97 to 2000-01
|
Change in Population, 1996-97 to 2000-01
|
|
| U.S. Total |
107,7541
|
16.3%
|
4.4%
|
| Payer Source | |||
| Privately Insured |
43,337
|
24.3
|
4.7
|
| Medicare |
16,026
|
10.0
|
4.1
|
| Medicaid |
18,417
|
0
|
10.0
|
| Self-Pay, No Charge (Uninsured) |
18,019
|
10.3
|
0.1
|
| 1 Workers’ compensation,
other coverage and unknown payer source are included in U.S. total. Note: All estimates reflect two-year averages. Sources: Estimates of ED visits are based on the National Hospital Ambulatory Medical Care Survey, Emergency Department Summary for 1996-2001, U.S. Department of Health and Human Services, Centers for Disease Control and Prevention, National Center for Health Statistics. Estimates of changes in the number of privately insured and uninsured persons are based on the Medical Expenditure Panel Survey (MEPS), Agency for Healthcare Research and Quality. Estimates of changes in Medicare and Medicaid enrollment are based on enrollment data from the Centers for Medicare and Medicaid Services |
|||
Other Ambulatory Care Trends for Insured, Uninsured
![]() comparison of trends in emergency department visits with visits to other ambulatory care providers, such as physicians or clinics, indicates that—despite greatly increased ED use—privately insured and Medicare beneficiaries have not increased their reliance on hospital emergency departments relative to other ambulatory care providers. For uninsured patients, however, reliance on emergency departments for medical care is high and has increased dramatically.
comparison of trends in emergency department visits with visits to other ambulatory care providers, such as physicians or clinics, indicates that—despite greatly increased ED use—privately insured and Medicare beneficiaries have not increased their reliance on hospital emergency departments relative to other ambulatory care providers. For uninsured patients, however, reliance on emergency departments for medical care is high and has increased dramatically.
For privately insured people, the 24 percent increase in ED visits parallels a more general trend of increased ambulatory care use, including a 31 percent increase in hospital outpatient department visits and a 29 percent increase in visits to physician offices between 1996-97 and 2000-01 (see Table 2). Because ambulatory care use increased across the board, emergency department visits as a proportion of all ambulatory care visits remained about 8 percent during this period for privately insured persons. Patterns of ambulatory care use by Medicare beneficiaries during this period were roughly similar, although the magnitude of the change was smaller than for the privately insured.
For Medicaid beneficiaries, the lack of change in ED visits was accompanied by an 8 percent decrease in hospital outpatient department visits and a 12.5 percent decrease in physician office visits. Emergency department visits as a proportion of all ambulatory care visits for Medicaid beneficiaries was more than double that of privately insured and Medicare beneficiaries in 2000-01—17.5 percent—and increased slightly from 1996-97 because of lower non-ED ambulatory care use.
Visits to physician offices by uninsured persons declined 37 percent between 1996-97 and 2000-01, although there was little change in hospital outpatient visits. But, combined with the increase in ED visits, uninsured people now rely on hospital emergency departments for one-fourth of their ambulatory care visits, a substantial increase from 17 percent in 1996-97. This greater reliance on emergency departments by uninsured persons is likely due to a decline in access to office-based physicians, as evidenced by declines in physician provision of charity care and fewer uninsured reporting that they have a usual source of care other than an emergency department.3
Back to Top
| Table 2 Trends in Ambulatory Care Use by Insurance Type, 1996-97 to 2000-01 |
||||
|
Private Insurance
|
Medicare
|
Medicaid
|
Self-Pay, No Charge (Uninsured)
|
|
| Change in Number of Visits, 1996-97 to 2000-01 | ||||
| Physician Office Visits |
29.0%
|
9.6%
|
-12.5%
|
-36.9%
|
| Hospital Outpatient Visits |
31.0
|
25.8
|
-8.1
|
-1.4
|
| Hospital ED Visits |
24.3
|
10.0
|
0.0
|
10.3
|
| ED Visits as a Proportion of All Ambulatory Care Visits | ||||
| 1996-97 |
7.9%
|
7.8%
|
15.9%
|
17.0%
|
| 2000-01 |
7.6
|
7.7
|
17.5
|
25.2
|
| Note: Estimates are based on two-year
averages for 1996-97 and 2000-01. Sources: Data on physician office visits are from the National Ambulatory Medical Care Survey, 1996-2001 Summaries. Data on hospital outpatient department visits are from the National Hospital Ambulatory Medical Care Survey: 1996-2001 Outpatient Department Summaries. Data on hospital emergency department visits are from the National Hospital Ambulatory Medical Care Survey: 1996-2001 Emergency Department Summaries. U.S. Department of Health and Human Services, Centers for Disease Control and Prevention, National Center for Health Statistics |
||||
| Table 3 Urgent/Nonurgent Status of Emergency Department Visits by Payer, 1999-2000 |
|||
|
Classified as Emergent/Urgent
|
Classified as Semi-Urgent or Nonurgent
|
Percent Unknown/No Triage
|
|
| All ED Visits |
47.3%
|
26.9%
|
25.8%
|
| Private Insurance |
46.8
|
26.5
|
26.7
|
| Medicare |
56.9
|
18.4
|
24.7
|
| Medicaid/SCHIP |
43.2
|
30.8
|
26.0
|
| Self-Pay, No Charge (Uninsured) |
44.2
|
31.3
|
24.5
|
| Notes: Estimates for 1999-2000
reflect a two-year average. Emergent/urgent visits are defined as those
where patients were triaged as requiring care within 60 minutes of arrival.
Semi-urgent/nonurgent visits are defined as those where patients were triaged
as requiring care within one to 24 hours of arrival. Source: National Hospital Ambulatory Medical Care Survey, Emergency Department Summary for 1997-2000, U.S. Department of Health and Human Services, Centers for Disease Control and Prevention, National Center for Health Statistics |
|||
Nonurgent Visits Dominate ED Trips
![]() ess than half of emergency department visits—47 percent—are classified as either emergent—requiring care within 15 minutes of arrival—or urgent—requiring care within an hour (see Table 3). This is true for all insurance groups with the exception of Medicare patients—about 57 percent of their visits are emergent or urgent. Moreover, visits classified as semi-urgent, nonurgent or unknown triage accounted for all of the overall emergency department visit increase across all insurance groups between 1996-97 and 2000-01.4
ess than half of emergency department visits—47 percent—are classified as either emergent—requiring care within 15 minutes of arrival—or urgent—requiring care within an hour (see Table 3). This is true for all insurance groups with the exception of Medicare patients—about 57 percent of their visits are emergent or urgent. Moreover, visits classified as semi-urgent, nonurgent or unknown triage accounted for all of the overall emergency department visit increase across all insurance groups between 1996-97 and 2000-01.4
Capacity constraints experienced by office-based physicians, combined with a loosening of managed care restrictions, may be contributing to increases in nonurgent ED visits. Other research shows that more patients are having difficulty making appointments with their doctors and more people have long waits for appointment.5 For their part, more physicians report having inadequate time to spend with their patients and are increasingly closing their practices to some new patients, despite spending more time in direct patient care activities.6 With extended hours and no appointment necessary, emergency departments increasingly may be viewed by many patients as more convenient sources of primary care than their regular physicians. For uninsured patients, EDs increasingly are one of the few remaining primary care options.
Physicians also may be responding to increased workload by referring patients to EDs with greater frequency, and declines in risk contracting and capitation mean they no longer have financial disincentives to do so.7 In some cases, increased utilization may be associated with physicians practicing defensive medicine by sending potentially risky patients to EDs instead of providing care in their offices.8
Back to Top
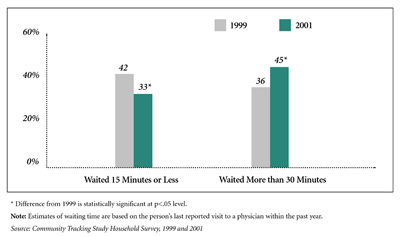
| Figure 1 Waiting Times for Emergency Department Visits, 1999 and 2001 |
 |
|
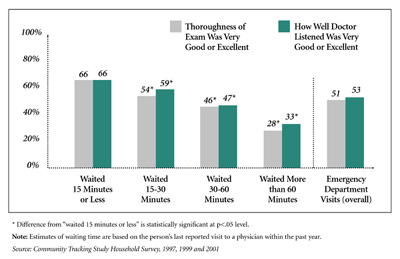
Figure 2 Patient Assessment of Visits to Emergency Departments |
 |
Trends in Waiting Times and Perceptions of Quality
![]() ncreased emergency department use has resulted in patients
waiting longer. During a two-year period alone, the proportion of emergency
department patients who waited more than 30 minutes increased from 36 percent
in 1999 to 45 percent in 2001, while the proportion waiting 15 minutes or less
decreased from 42 percent to 33 percent (see Figure 1). Waiting times for walk-in
visits at other ambulatory providers, such as freestanding urgent care centers
or community health centers, are shorter than at EDs, and waiting times did
not increase as much at these facilities as they did at emergency departments
(see Supplemental Tables).
ncreased emergency department use has resulted in patients
waiting longer. During a two-year period alone, the proportion of emergency
department patients who waited more than 30 minutes increased from 36 percent
in 1999 to 45 percent in 2001, while the proportion waiting 15 minutes or less
decreased from 42 percent to 33 percent (see Figure 1). Waiting times for walk-in
visits at other ambulatory providers, such as freestanding urgent care centers
or community health centers, are shorter than at EDs, and waiting times did
not increase as much at these facilities as they did at emergency departments
(see Supplemental Tables).
Uninsured and Medicaid patients experience longer waiting times at hospital EDs and other types of ambulatory care providers than do privately insured people and Medicare beneficiaries (see Supplemental Tables). These longer waiting times may reflect in part differences across insurance groups in the type and severity of health problems presented at the ED. Also, ED visits by uninsured and Medicaid patients are likely to be more concentrated at certain hospitals, such as urban public hospitals, that are especially crowded because they serve a large number of low-income and medically indigent people who rely on emergency departments as their usual source of care.
Back to Top
Longer Waits Mean Lower Perceptions of Quality
![]() onger emergency department waiting times are associated with dramatically lower patient perceptions of the quality of their care.
onger emergency department waiting times are associated with dramatically lower patient perceptions of the quality of their care.
According to the Community Tracking Study Household Survey, among ED patients who waited more than an hour for treatment, only 28 percent rated the thoroughness of their exam as very good or excellent, and only one-third gave a positive assessment of how well the doctor listened to them (see Figure 2). This compares with a positive assessment of the exam and physician by 66 percent who waited 15 minutes or less. It is unknown whether these large differences in length of waiting time reflect actual differences in clinical quality. Clearly, longer waiting times increase patient frustration and are indicative of a busy emergency department, which may result in less time spent with individual patients when they are seen.
Patient perceptions of ED care quality also are much lower than perceptions of care at other ambulatory care providers, even for patients with similar waiting times. For example, 77 percent of patients with scheduled appointments at other ambulatory care providers gave very positive ratings to how well the doctor listened, compared with 53 percent of ED patients.
Implications
![]() mergency department crowding has complex causes and, in many ways, is a symptom of more general trends in the health care system, including capacity constraints throughout the system, increased demand for medical care among many insured patients and decreased access to care for uninsured patients.
mergency department crowding has complex causes and, in many ways, is a symptom of more general trends in the health care system, including capacity constraints throughout the system, increased demand for medical care among many insured patients and decreased access to care for uninsured patients.
For some hospitals, inpatient and intensive care unit capacity constraints are more responsible for ED backups than is increased patient ED use.9 Increased demand for care among privately insured patients may be contributing to capacity constraints among office-based physicians and clinics, with at least some of the excess demand for nonurgent care spilling over into hospital EDs. Higher overall patient caseloads, combined with lower reimbursement from private and public payers, are compelling many medical practices to limit care provided to uninsured patients, leading the uninsured to seek more of their care in EDs as one of their few remaining options.
Increased emergency department use is also likely to have consequences for the health care system beyond the longer waiting times and potentially lower patient satisfaction with care shown in this study. Because the cost of treating patients is higher in the ED than in other outpatient clinics and medical practices, privately insured persons’ increased use of the ED for many nonurgent health problems will contribute to higher health insurance costs, which already have risen at double-digit rates for several years.
Also, emergency departments traditionally have provided a community benefit as the one place available all hours of the day regardless of ability to pay, and they are critical for responding to public emergencies related to public health, terrorism and naturally occurring disasters. Therefore, crowding could limit the ability of EDs to fulfill their community benefit function in responding to such emergencies.
Attempts by private managed care plans during the 1990s to promote more efficient and cost-effective care—in part by restricting ED use for nonurgent problems—resulted in a consumer backlash. The subsequent retreat from tight managed care restrictions by private insurance plans may have contributed to the large increase in ED use—as well as other forms of ambulatory care—by privately insured persons. The lack of change in ED visits among Medicaid beneficiaries may be evidence of a stronger and still-growing influence of managed care in Medicaid, although reliance on EDs among Medicaid beneficiaries remains much higher than for privately insured people and Medicare beneficiaries.
Higher copayments for nonurgent ED use may be one of the few tools that private health plans have left to control use. Charging uninsured patients more—or being more aggressive in collecting payments—may be more effective in reducing nonurgent use of the ED by uninsured patients, but such measures would do little to stem the overall increase in ED use. And since the uninsured increasingly have nowhere else to go, discouraging ED use without providing alternative sources of primary and specialty care could generate an even more serious crisis in access to medical care for the uninsured.
Back to Top
Data Sources
Trends in hospital ED and outpatient department visits are based on the National Hospital Ambulatory Medical Care Survey (NHAMCS). Visit trends for other ambulatory care are based on the National Ambulatory Medical Care Survey (NAMCS). These surveys—conducted annually by the National Center for Health Statistics as part of the National Health Care Survey—are designed to provide nationally representative estimates of ambulatory care visits to hospitals and physician offices in the United States. NHAMCS samples visits to hospital emergency and outpatient departments of nonfederal, short-stay and general hospitals, while NAMCS samples visits to nonfederally employed physicians providing office-based patient care. For 2001, the total number of patient record forms providing data was 34,546 for emergency department visits, 33,567 for hospital outpatient visits and 24,281 for physician office visits. For a more detailed description of the surveys, see www.cdc.gov/nchs/about/major/ahcd/ahcd1.htm.
Trends in waiting times for ED visits and patients’ perceptions of quality are based on the Community Tracking Study Household Survey, a nationally representative telephone survey of the civilian, noninstitutionalized population conducted in 1996-97, 1998-99 and 2000-01. Data were supplemented by in-person interviews of households without telephones to ensure proper representation. The survey contains information on approximately 60,000 persons, and the average response rate for the three surveys was about 60 percent. The survey findings in this report are based on the last reported visit to an ambulatory care provider in the year before the survey interview.
Notes
| 1. | McCaig, Linda F., and Catherine W. Burt, "National Hospital Ambulatory Medical Care Survey: 2001 Emergency Department Summary: 2001,"Advance Data From Vital and Health Statistics; No. 335,: National Center for Health Statistics, Hyattsville, Md. (2003); U.S. General Accounting Office, Hospital Emergency Departments: Crowded Conditions Vary Among Hospitals and Communities (GAO-03-460), Washington, D.C. (March 2003). |
| 2. | Other unspecified insurance coverage, worker’s compensation, and unknown coverage account for the remaining portion of the ED visit increase (about 23%). |
| 3. | Cunningham, Peter J., Mounting Pressures: Physicians Serving Medicaid Patients and the Uninsured, 1997-2001, Tracking Report No. 6, Center for Studying Health System Change, Washington, D.C. (December 2002); Cunningham, Peter J., "Does a Rising Tide Lift All Boats: Insurance Coverage Expansions and the Spillover Effect on Access to Care," HSC Working Paper (2003). |
| 4. | Some caution should be used in inferring changes in ED visits by level of urgency. About one-fourth of ED visits are classified as "unknown" triage, and these types of visits increased during the study period. Also, some misclassification of visits into the four-level triage used by NHAMCS may occur, as most hospitals use three-level triage, and a small proportion use five-level triage. |
| 5. | Strunk, Bradley C., and Peter J. Cunningham, Treading Water: Americans’ Access to Needed Medical Care, 1997-2001, Tracking Report No.1, Center for Studying Health System Change, Washington, D.C. (March 2002). |
| 6. | Trude, Sally, So Much to Do, So Little Time: Physician Capacity Constraints, 1997-2001, Tracking Report No. 8, Center for Studying Health System Change, Washington, D.C. (May 2003). |
| 7. | Brewster, Linda R., Liza Rudell and Cara S. Lesser, Emergency Room Diversions: A Symptom of Hospitals Under Stress, Issue Brief No. 38, Center for Studying Health System Change, Washington, D.C. (May 2001). |
| 8. | Berenson, Robert, Sylvia Kuo and Jessica May, Medical Malpractice Liability Crisis Meets Markets: Stress in Unexpected Places, Issue Brief No. 68, Center for Studying Health System Change, Washington, D.C. (September 2003). |
| 9. | U.S. General Accounting Office, March 2003, op. cit. |
Back to Top
Supplemental Tables
Supplemental Table 1: Trends
in Ambulatory Care Use, 1996-2001
Supplemental Table 2: Office
Waiting Times for Emergency Departments and Other "Walk-in" Facilities
Supplemental Table 3: Office
Waiting Times for Emergency Departments and Other "Walk-in" Facilities,
by Insurance Status
Supplemental Table 4: Patient
Assessment of Visits to Emergency Rooms and Other "Walk-in" Facilities
Supplemental Table 5: Satisfaction
with Care by Type of Last Visit and Insurance Status
ISSUE BRIEFS are published by the Center for Studying Health System Change.
President: Paul B. Ginsburg
Editor: The Stein Group
For additional copies or to be added to the mailing list, contact HSC at:
600 Maryland Avenue, SW
Suite 550
Washington, DC 20024-2512
Tel: (202) 484-5261 (for general HSC information)
Fax: (202) 484-9258
www.hschange.org