
Unequal Access: African-American Medicare Beneficiaries and the Prescription Drug Gap
Issue Brief No. 64
July 2003
Marie C. Reed, J. Lee Hargraves, Alwyn Cassil
![]() frican-American Medicare beneficiaries age 65 and older are more than twice as
likely as elderly white beneficiaries to report they could not afford to fill at least one
prescription in the last year, according to a new study by the Center for Studying
Health System Change (HSC). Older African-American beneficiaries are much more
likely to be poor and to lack supplemental insurance. They also are more likely to live
with certain chronic conditions—heart disease, high blood pressure and diabetes—
that generally require prescription drug treatment. As policy makers debate how to
structure a Medicare drug benefit, designing a comprehensive benefit with minimal
out-of-pocket costs for low-income elderly Americans could substantially narrow
the prescription drug gap between black and white seniors.
frican-American Medicare beneficiaries age 65 and older are more than twice as
likely as elderly white beneficiaries to report they could not afford to fill at least one
prescription in the last year, according to a new study by the Center for Studying
Health System Change (HSC). Older African-American beneficiaries are much more
likely to be poor and to lack supplemental insurance. They also are more likely to live
with certain chronic conditions—heart disease, high blood pressure and diabetes—
that generally require prescription drug treatment. As policy makers debate how to
structure a Medicare drug benefit, designing a comprehensive benefit with minimal
out-of-pocket costs for low-income elderly Americans could substantially narrow
the prescription drug gap between black and white seniors.
- Black Seniors More Likely to Go Without Prescriptions
- Income Matters
- Supplemental Insurance Helps
- The Role of Health
- Other Disparities
- Policy Implications
- Data Source
- Notes
- Supplemental Tables
Black Seniors More Likely to Go Without Prescriptions
![]() rescription drugs are an essential
aspect of modern medical care,
especially for older Americans. Since
Medicare does not cover most outpatient
prescription drugs, elderly Americans
often have trouble affording the drugs
they need to stay healthy and active.
rescription drugs are an essential
aspect of modern medical care,
especially for older Americans. Since
Medicare does not cover most outpatient
prescription drugs, elderly Americans
often have trouble affording the drugs
they need to stay healthy and active.
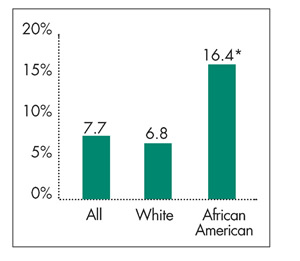
Nationwide, about one in 12 Medicare beneficiaries age 65 and older 1 reported they could not afford to fill at least one prescription in the previous year, according to HSC’s 2001 Community Tracking Study Household Survey (see Figure 1). Other research indicates many seniors also may skip doses to stretch prescriptions or go without other necessities to buy medications. 2
African-American seniors clearly have more problems affording prescription medications. Almost one in six elderly black Medicare beneficiaries could not afford to fill at least one prescription in 2001, compared with one in 15 elderly whites. African Americans’ lower incomes, lack of supplemental insurance and greater prevalence of certain chronic conditions all contribute to the prescription drug access gap between older black and white Americans.
|
Figure 1 Medicare Beneficiaries 65 and Older Who Did Not Purchase at Least One Prescription Drug in 2001 Because of Cost by Race |
 |
|
* African-American/white comparison is statistically significant at p<.05.
Notes:Medicare beneficiaries limited to noninstitutionalized population. Both racial categories exclude persons of Latino ethnicity. Source: HSC Community Tracking Study Household Survey, 2000-01 |
Back to Top
Income Matters
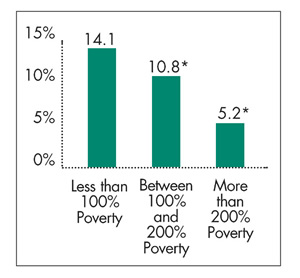
Poor elderly Medicare beneficiaries—those with incomes below 100 percent of the federal poverty level, or $8,590 for a single person in 2001—are nearly three times as likely as beneficiaries with incomes above 200 percent of poverty to report not filling at least one prescription because of cost (see Figure 2). Low-income older Americans—those with incomes between 100 percent and 200 percent of poverty—are twice as likely as those with higher incomes to have gone without at least one prescription in the previous year.
The lower incomes of older African Americans partially explain why they are less likely than whites to fill all of their prescriptions (see Table 1).Nearly four in 10 elderly black Medicare beneficiaries lived in poverty in 2001, compared with one in 10 whites (see Table 2). About two in 10 older black and white Americans had incomes between 100 percent and 200 percent of poverty, while four in 10 elderly African Americans had incomes above 200 percent of poverty, compared with more than six in 10 older whites.
|
Figure 2 Medicare Beneficiaries 65 and Older Who Did Not Purchase at Least One Prescription Drug in 2001 Because of Cost by Income |
 |
|
* Comparison with "less than 100% poverty" is statistically
significant at p<.05.
Note:Medicare beneficiaries limited to noninstitutionalized population. Source: HSC Community Tracking Study Household Survey, 2000-01 |
| Table 1 Medicare Beneficiaries 65 and Older Who Did Not Purchase at Least One Prescription Drug in 2001 Because of Cost by Income and Race |
|||
|
White
|
African American
|
||
| Poor (Less Than Poverty) | 13% |
20% |
|
| Low Income (Between 100% and 200% Poverty) | 10 |
19* |
|
| Higher Income (200+% Poverty) | 5# |
11*# |
|
| *African-American/white comparison is statistically significant at p<.05. # Poor/higher income is statistically significant at p<.05. Notes:Medicare beneficiaries limited to noninstitutionalized population. Both racial categories exclude persons of Latino ethnicity. Source: HSC Community Tracking Study Household Survey, 2000-01 |
|||
| Table 2 Income Distribution and Supplemental Insurance of Medicare Beneficiaries 65 and Older in 2001 by Race |
|||
|
White
|
African American
|
||
| Income/Poverty Status | |
|
|
| Low Income (Between 100% and 200% Poverty) |
23%
|
21%
|
|
| Higher Income (200+% Poverty) | 66 |
41* |
|
| Type of Supplemental Insurance | |
|
|
| Medicare Plus Job-Sponsored Supplemental |
32
|
20*
|
|
| Medicare Plus Other Private Supplemental | 33 |
19* |
|
| Medicare HMO | 20 |
20 |
|
| Medicare Plus Other Public | 5 |
13* |
|
| Traditional Medicare Only | 10 |
27* |
|
| *African-American/white comparison
is statistically significant at p<.05. Notes:Medicare beneficiaries limited to noninstitutionalized population. Both racial categories exclude persons of Latino ethnicity. Columns may not sum to 100 due to rounding. Source: HSC Community Tracking Study Household Survey, 2000-01 |
|||
Back to Top
Supplemental Insurance Helps
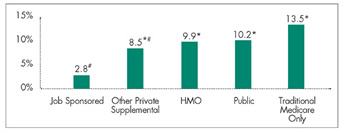
Supplemental health insurance, which may include some drug coverage, helps many elderly Medicare beneficiaries afford prescription drugs (see Figure 3). In 2001, less than 3 percent of elderly Medicare beneficiaries with job-sponsored supplemental insurance said they could not afford to fill at least one prescription. In contrast, nearly 14 percent of beneficiaries whose only coverage was traditional fee-for-service Medicare reported problems affording prescription drugs.
To a lesser extent, other types of public and private supplemental insurance decreased the proportion of Medicare beneficiaries reporting problems affording prescription drugs.
The different pattern of supplemental coverage for elderly black and white Medicare beneficiaries helps to explain the prescription drug access gap between blacks and whites (see Table 2). African-American beneficiaries are much more likely to lack supplemental coverage, with nearly 30 percent of older blacks in 2001 having only traditional fee-for- service Medicare coverage, compared with 10 percent of whites.
Close to 40 percent of elderly black Americans had private supplemental insurance in 2001, whether through a former employer or directly purchased, compared with 65 percent of white beneficiaries. Reflecting their greater likelihood of being poor, 13 percent of elderly black Medicare beneficiaries had supplemental public coverage, such as Medicaid, compared with 5 percent of whites.About the same proportion (20%) of elderly black and white beneficiaries were enrolled in health maintenance organizations, such as Medicare+Choice.
Figure 3
Medicare Beneficiaries 65 and Older Who Did Not Purchase at Least One Prescription Drug in 2001 Because of Cost by Type of Supplemental Insurance
* Comparison with "less than 100% poverty" is statistically significant at p<.05.
Note:Medicare beneficiaries limited to noninstitutionalized population.
Source: HSC Community Tracking Study Household Survey, 2000-01
Back to Top
The Role of Health
Elderly Medicare beneficiaries living with chronic conditions 3 are more likely to have problems affording prescription drugs (see Figure 4). Certain chronic conditions—heart disease, high blood pressure and diabetes, for example—usually require treatment with prescription drugs, and going without prescribed medications can pose serious health consequences. For example, complications of adult-onset diabetes, such as renal failure, blindness and gangrene, often can be avoided when blood sugar is regulated through diet and appropriate use of prescription drugs. Elderly Medicare beneficiaries with heart disease, high blood pressure and/or diabetes were twice as likely as those with no chronic condition to have problems affording prescription drugs, and beneficiaries with multiple chronic conditions were 2.5 times as likely to have problems.
About 30 percent of both elderly black and white Medicare beneficiaries live with one chronic condition. However, black beneficiaries are more likely to have multiple chronic conditions—48 percent of blacks vs. 42 percent of whites. At age 65, life expectancy for white Medicare beneficiaries is 10 percent higher than for African Americans. 4 Chronic conditions such as heart disease, high blood pressure and diabetes contribute significantly to these differences in life expectancy. 5 Elderly black Medicare beneficiaries are more likely than whites to live with heart disease, high blood pressure and diabetes—67 percent of blacks vs. 55 percent of whites.
Figure 4
Medicare Beneficiaries 65 and Older Who Did Not Purchase at Least One Prescription Drug in 2001 Because of Cost by Income
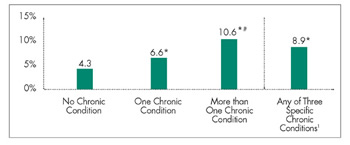
* Comparison with "less than 100% poverty" is statistically significant at p<.05.
Note:Medicare beneficiaries limited to noninstitutionalized population.
Source: HSC Community Tracking Study Household Survey, 2000-01
Back to Top
Other Disparities
Multivariate analysis indicates that differences in income, supplemental insurance coverage and presence of chronic conditions account for close to half (46%) of the 10-percentage-point gap in prescription drug access between black and white seniors. Another portion of the gap—nearly 20 percent—is explained by other socioeconomic factors, such as gender, age, family size and education. 6
The remaining prescription drug access gap between black and white Medicare beneficiaries likely results from a variety of other influences. For example, research indicates that wealth—savings or other assets—is a factor in elderly Medicare beneficiaries’ ability to pay for medical care not covered by Medicare, including prescription drugs. 7 Since people with savings, for example, do not need to rely exclusively on income to afford prescription drugs, differences in wealth may explain some of the remaining access gap between black and white beneficiaries.
Back to Top
Policy Implications
![]() lthough about two-thirds of elderly Medicare beneficiaries
have some prescription drug coverage through a patchwork of public and private
sources, 8 access to affordable prescription drugs
is likely to be a growing problem for American seniors. Employers are scaling
back retiree coverage, state budget shortfalls may curtail Medicaid drug coverage
for seniors and many Medicare+Choice plans have reduced prescription drug coverage
in recent years.
lthough about two-thirds of elderly Medicare beneficiaries
have some prescription drug coverage through a patchwork of public and private
sources, 8 access to affordable prescription drugs
is likely to be a growing problem for American seniors. Employers are scaling
back retiree coverage, state budget shortfalls may curtail Medicaid drug coverage
for seniors and many Medicare+Choice plans have reduced prescription drug coverage
in recent years.
The U.S. House and Senate both recently passed legislation to provide Medicare outpatient prescription drug benefits. Although details of the two chambers’ proposals differ significantly, both provide targeted assistance to some low-income beneficiaries—particularly those with incomes up to 135 percent of poverty—through premium subsidies and reduced cost sharing. 9
While either proposal, if enacted, could help reduce racial disparities in access to prescription drugs among the poorest beneficiaries, both proposals would leave many low-income beneficiaries—those with incomes above 135 percent but below 200 percent of poverty—with substantial out-of-pocket costs relative to their incomes if they need ongoing or expensive drug therapies. Other research has shown that even minimal patient cost-sharing requirements can pose barriers to low-income people.
Creating a comprehensive Medicare prescription drug benefit with minimal out-of-pocket costs for all elderly Americans with incomes below 200 percent of poverty could significantly narrow the access gap between black and white seniors.
Back to Top
Data Source
![]() his Issue Brief presents findings from
the HSC Community Tracking Study
Household Survey, a nationally representative
telephone survey of the civilian,
noninstitutionalized population
conducted in 2000-01. Data were
supplemented by in-person interviews
of households without telephones to
ensure proper representation. The
survey contains information on about
60,000 people, including approximately
7,700 elderly Medicare beneficiaries,
and the response rate was 59 percent.
Estimates in the Issue Brief reflect the
percentage of Medicare beneficiaries
who responded "yes" to the following
question: "During the past 12 months,
was there any time you needed prescription
medicines but didn’t get
them because you couldn’t afford
it?" More detailed information on
survey methodology can be found at
www.hschange.org.
his Issue Brief presents findings from
the HSC Community Tracking Study
Household Survey, a nationally representative
telephone survey of the civilian,
noninstitutionalized population
conducted in 2000-01. Data were
supplemented by in-person interviews
of households without telephones to
ensure proper representation. The
survey contains information on about
60,000 people, including approximately
7,700 elderly Medicare beneficiaries,
and the response rate was 59 percent.
Estimates in the Issue Brief reflect the
percentage of Medicare beneficiaries
who responded "yes" to the following
question: "During the past 12 months,
was there any time you needed prescription
medicines but didn’t get
them because you couldn’t afford
it?" More detailed information on
survey methodology can be found at
www.hschange.org.
Back to Top
Notes
| 1. | Elderly Medicare beneficiaries, excluding those in institutions such as nursing homes. |
| 2. | Safran, Dana, et al., "Prescription Drug Coverage and Seniors: How Well Are States Closing the Gap?" Health Affairs Web Exclusive (Feb. 13, 2003). |
| 3. | Individuals were classified as having a chronic condition if they reported seeing a doctor or other health professional in the past two years for at least one of the following conditions: diabetes, arthritis, asthma, chronic obstructive pulmonary disease, heart disease, hypertension, cancer or depression. |
| 4. | In 1997, for example, average life expectancy at age 65 was 16.1 years for African Americans and 17.8 years for non-Hispanic whites, www.nia.nih.gov/health/pubs/portfolio/html/disparities.htm, accessed July 1, 2003. |
| 5. | Wong,Mitchell, et al., "Contribution of Major Diseases to Disparities in Mortality," New England Journal of Medicine,Vol. 347, No. 20 (Nov. 14, 2002). |
| 6. | Full model includes race/ethnic category, income, supplemental insurance type, number of chronic conditions, gender, age, family size and status, education, employer type, smoking status, health as measured by the SF-12 and cost of living index. Details and results of multivariate model can be found at www.hschange.org/index.cgi?func=supp. |
| 7. | Goldman, Dana, and Julie Zissimopoulos, "High Out-of-Pocket Health Care Spending by the Elderly," Health Affairs,Vol. 22, No. 3 (May/June 2003). |
| 8. | Laschober,Mary, et al., "Trends in Medicare Supplemental Insurance and Prescription Drug Coverage, 1996-1999," Health Affairs Web Exclusive (Feb. 27, 2002). |
| 9. | The House legislation (H.R. 1) provides premium and cost-sharing assistance up to 135 percent of the federal poverty level and full or partial premium assistance up to 150 percent of poverty; the Senate legislation (S. 1) provides full or partial premium and cost-sharing assistance up to 160 percent of poverty. Both bills limit the amount of assets that qualifying beneficiaries can own. |
Back to Top
Supplementary Tables
Supplementary Table 1: Reported
and Predicted Percentages of Medicare Beneficiaries 65 and Older Not Purchasing
at Least One Prescription Drug in 2001 Because of Cost
Supplementary Table 2: Medicare
Beneficiaries 65 and Older Not Purchasing at Least One Prescription Drug in
2001 Because of Cost: Logistic Regression Results
Supplementary Table 3: Chronic
Condition Status of Medicare Beneficiaries 65 and Older by Race
ISSUE BRIEFS are published by the Center for Studying Health System Change.
President: Paul B. Ginsburg
Editor: The Stein Group
For additional copies or to be added to the mailing list, contact HSC at:
600 Maryland Avenue, SW
Suite 550
Washington, DC 20024-2512
Tel: (202) 554-7549 (for publication information)
Tel: (202) 484-5261 (for general HSC information)
Fax: (202) 484-9258
www.hschange.org