
So Much to Do, So Little Time: Physician Capacity Constraints, 1997-2001
Tracking Report No. 8
May 2003
Sally Trude
![]() igns of tightened physician capacity1—or physicians’ ability
to provide services relative to demand—appeared between
1997 and 2001, according to a study by the Center for Studying
Health System Change (HSC). Patients waited longer for
appointments, and more physicians reported having inadequate
time with patients. Despite signs of tightened physician capacity,
the supply of physicians grew modestly, the proportion of
physicians working with nurse practitioners and other caregivers
increased and doctors spent more time in direct patient care.
This seeming contradiction emerged as the retreat from tightly
managed care gave patients freedom to seek more care without
substantial out-of-pocket cost increases. Current physician
capacity constraints may ease if higher out-of-pocket costs
prompt patients to seek less care.
igns of tightened physician capacity1—or physicians’ ability
to provide services relative to demand—appeared between
1997 and 2001, according to a study by the Center for Studying
Health System Change (HSC). Patients waited longer for
appointments, and more physicians reported having inadequate
time with patients. Despite signs of tightened physician capacity,
the supply of physicians grew modestly, the proportion of
physicians working with nurse practitioners and other caregivers
increased and doctors spent more time in direct patient care.
This seeming contradiction emerged as the retreat from tightly
managed care gave patients freedom to seek more care without
substantial out-of-pocket cost increases. Current physician
capacity constraints may ease if higher out-of-pocket costs
prompt patients to seek less care.
- Physician Supply Grows
- Physicians Spend More Time on Patient Care
- More People Saw Doctors
- Where Does All the Time Go?
- More Specialty Referrals
- The Shifting Marketplace
- Data Source
- Notes
- Supplementary Tables
Physician Supply Grows
![]() he number of physicians in the United States continued
to increase between 1995 and 2000, from 260 to 276 physicians per 100,000 people.2
However, debates about a potential physician shortage have re-emerged.
he number of physicians in the United States continued
to increase between 1995 and 2000, from 260 to 276 physicians per 100,000 people.2
However, debates about a potential physician shortage have re-emerged.
As the practice of medicine changes rapidly and becomes increasingly complex, physicians have more diagnostic and treatment options for a larger pool of patients. Medical advances have transformed once terminal diseases—for example, many types of cancer—into chronic conditions that physicians must manage long term. Increased treatment capabilities may be causing physicians to shift how they spend time as they provide and interpret more diagnostic information and discuss results and treatment options with their patients and other physicians.
The current transition in the health care marketplace away from tight health plan restrictions also may have sparked temporary capacity constraints for physician services, complicating the debate about a potential physician shortage.
Back to Top
Physicians Spend More Time on Patient Care
![]() hysicians spent more time in direct patient care between
1997 and 2001, but they worked fewer hours overall, according to the HSC Community
Tracking Study Physician Survey. The time physicians spent in direct patient
care grew from 44.7 hours a week in 1997 to 46.6 hours in 2001, while their
average medically related work week fell from 55.5 hours to 54.4 hours during
the same period (see Table 1). Overall, the proportion
of time physicians spent in direct patient care activities increased from 81
percent in 1997 to 86 percent in 2001.
hysicians spent more time in direct patient care between
1997 and 2001, but they worked fewer hours overall, according to the HSC Community
Tracking Study Physician Survey. The time physicians spent in direct patient
care grew from 44.7 hours a week in 1997 to 46.6 hours in 2001, while their
average medically related work week fell from 55.5 hours to 54.4 hours during
the same period (see Table 1). Overall, the proportion
of time physicians spent in direct patient care activities increased from 81
percent in 1997 to 86 percent in 2001.
Medically related activities include time spent on administrative tasks, professional activities and direct patient care but exclude time spent on call when not actually working. Direct care of patients includes face-to-face contact with patients, as well as patient record-keeping and office work, travel time to see patients and communication with physicians, hospitals, pharmacies and others on patients’ behalf.
Constrained physician capacity also may be affecting physicians’ willingness to accept new patients. A growing proportion of physicians no longer accepts all new Medicare and privately insured patients, possibly because physicians face more patients seeking care and growing time pressures. The proportion of physicians accepting all new Medicare patients fell from 73 percent in 1997 to 69 percent in 2001, while the proportion of physicians accepting all new privately insured patients fell from 70.8 percent to 68.2 percent over the same period.
At the same time, more physician practices employed physician assistants, nurse practitioners, nurse midwives and clinical nurse specialists. The proportion of physicians in noninstitutional practice settings who worked with these caregivers increased from 40 percent in 1997 to 48 percent in 2001 (see Figure 1). The trend was most noticeable for group practices of three or more physicians, where the proportion employing nonphysician caregivers grew from 53 percent in 1997 to 66 percent in 2001.
Despite spending more time in direct patient care, a growing proportion of physicians reported having inadequate time with their patients.
Figure 1
Physicians in Practices1 with Allied Health Professionals,2 by Type of Practice
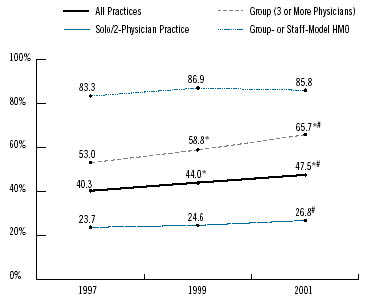
1 Practices in noninstitutional settings.
2 Includes physician assistants, nurse practitioners, nurse midwives and clinical nurse specialists.
* Change from previous survey is statistically significant at p<.05.
# Change from 1997-2001 is statistically significant at p<.05.
Source: HSC Community Tracking Study Physician Survey
| TABLE 1: Physician Time Spent in Medically Related Activity and Direct Patient Care | |||
1997 |
1999 |
2001 |
|
| Medically Related: Average Weekly Hours |
55.5 hours |
54.5 hours* |
54.4 hours# |
| Direct Patient Care: Average Weekly Hours |
44.7 |
44.7 |
46.6*# |
| Percent of Time in Direct Patient Care |
81.0% |
82.6% |
86.3%*# |
|
* Change from previous survey is statistically significant at p<.05. # Change from 1997-2001 is statistically significant at p<.05. Source: HSC Community Tracking Study Physician Survey |
|||
Back to Top
More People Saw Doctors
![]() he proportion of Americans who saw a physician at
least once during the year grew slightly between 1997 and
2001, from 77 percent to 78 percent. Although slightly
more people saw a doctor, and physicians spent more
time in direct patient care, the average number of doctor
visits per person remained constant.
he proportion of Americans who saw a physician at
least once during the year grew slightly between 1997 and
2001, from 77 percent to 78 percent. Although slightly
more people saw a doctor, and physicians spent more
time in direct patient care, the average number of doctor
visits per person remained constant.
Between 1997 and 2001, people had an average of 3.8 physician office visits a year. Practices’ employment of nonphysician practitioners did not boost the average number of office visits per person, and the average number of office visits to either a physician or nurse practitioner remained unchanged—about four a year. Yet, more people reported seeing a nurse practitioner at least once during the year, with the proportion rising from 12 percent in 1997 to 15 percent in 2001.
Since the average number of office visits to either a physician or nurse practitioner was constant between 1997 and 2001, a possible explanation for the increase in people seeing a nurse practitioner is that more patients are seeing both a physician and a nurse practitioner during the same visit.
Back to Top
Where Does All the Time Go?
![]() espite spending more time in direct patient care, a growing
proportion of physicians reported having inadequate time with their patients.When
asked to agree or disagree with the statement, "I have adequate time to spend
with my patients during office hours," 34 percent disagreed in 2001, compared
with 28 percent in 1997 (see Figure 2). Other research,
however, shows that time physicians spend face to face with patients did not
change during the same period.3
espite spending more time in direct patient care, a growing
proportion of physicians reported having inadequate time with their patients.When
asked to agree or disagree with the statement, "I have adequate time to spend
with my patients during office hours," 34 percent disagreed in 2001, compared
with 28 percent in 1997 (see Figure 2). Other research,
however, shows that time physicians spend face to face with patients did not
change during the same period.3
Medical advances mean more treatment options are available to more patients. People are living longer with chronic illnesses that may require more complex coordination with other caregivers.With more diagnostic and treatment options available, physicians’ increased time in direct patient care may reflect more time spent on patient care activities other than face-to-face visits with patients.
A growing list of recommended preventive services also may be consuming primary care physicians’ time with patients. A recent study4 estimated that if doctors followed all government recommendations aimed at preventing disease and injury, they would spend more than seven hours a day on the standards. Physicians may be frustrated by having too much to discuss with their patients in too little time.
Another indication of strained physician capacity is the growing proportion of people who did not get or postponed needed care because they could not get a timely appointment. In 2001, 5 percent of Americans did not get or postponed care because they couldn’t get an appointment soon enough, compared with 3.4 percent in 1997.
Less-restrictive managed care practices and broader provider networks likely have made it easier for patients to see the physician of their choice. More patients can now bypass gatekeepers and preauthorization requirements when seeing specialists. Moreover, in 2001, because of the tight labor market, employers were reluctant to pass the rising costs of health insurance on to their workers and only made small increases to copayments and deductibles.
People may be receiving more care as a result of fewer restrictions and no substantial out-of-pocket cost increase. Without a significant expansion in physician capacity, fewer managed care restrictions may have led to longer waits for appointments. However, as consumers must pay more out of pocket at the doctor’s office, current capacity constraints may ease.
Figure 2
Physicians Reporting Inadequate Time with Patients
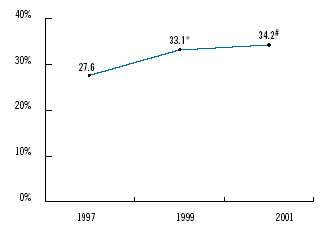
* Change from previous survey is statistically significant at p<.05.
# Change from 1997-2001 is statistically significant at p<.05.
Source: HSC Community Tracking Study Physician Survey
Back to Top
More Specialty Referrals
![]() growing proportion of primary care physicians reported
referring more patients to specialists. In 2001, about one in four primary care
physicians said they had referred more patients to specialists in the past two
years, compared with less than one in five physicians in 1997 (see
Table 2). Over this same period, managed care plans lifted many of the restrictions
they had imposed on access to specialists, which likely accounts for some of
the increase in referrals.
growing proportion of primary care physicians reported
referring more patients to specialists. In 2001, about one in four primary care
physicians said they had referred more patients to specialists in the past two
years, compared with less than one in five physicians in 1997 (see
Table 2). Over this same period, managed care plans lifted many of the restrictions
they had imposed on access to specialists, which likely accounts for some of
the increase in referrals.
Yet, the proportion of primary care physicians who reported problems arranging referrals to specialists also grew slightly. Physicians were asked whether they were always, almost always, frequently, sometimes, rarely or never able to obtain referrals to high-quality specialists. Physicians were considered to have problems obtaining referrals if they reported "sometimes, rarely or never." Between 1997 and 2001, the proportion of primary care physicians reporting problems arranging specialty referrals increased from 4.8 percent to 7.2 percent. In contrast, the proportion of medical specialists who reported problems stayed about the same, while the proportion of surgical specialists who reported problems fell.
Waiting times for an appointment with a specialist grew between 1997 and 2001, but waiting times for primary care physicians remained unchanged. Half of all patients seeing a specialist for a specific illness waited 8.1 days or more in 2001, compared with 6.6 days or more in 1997. Half of all patients seeking an appointment with a primary care physician for a specific illness waited about a day.
Changes in specialists’ willingness to accept all new patients regardless of their insurance coverage depended on the physician’s specialty. Surgical specialists’ willingness to accept all new Medicare, Medicaid and privately insured patients declined from 51 percent to 45 percent between 1997 and 2001. In contrast, a growing proportion of medical specialists accepted all new patients, while there was no change in the proportion of primary care physicians who accepted all new patients.
| TABLE 2: Referrals to Specialists | |||
1997 |
1999 |
2001 |
|
| Primary Care Physicians Reporting Increased Referrals to Specialists over the Last Two Years |
|||
17.8% |
21.6%* |
25.5%*# |
|
| Reporting Problems Obtaining Referral to Specialists | |||
| Primary Care Physicians | 4.8 |
4.6 |
7.2*# |
| Medical Specialists | 10.8 |
11.3 |
10.2 |
| Surgical Specialists | 12.2 |
12.2 |
7.8*# |
|
* Change from previous survey is statistically significant at p<.05. # Change from 1997-2001 is statistically significant at p<.05. Source: HSC Community Tracking Study Physician Survey |
|||
Back to Top
The Shifting Marketplace
![]() evived debates about the adequacy of physician supply
are occurring during an imbalance between patients seeking medical care and
physician capacity. Yet, people on both sides of the debate agree that physician
supply decisions should reflect long-term needs and not temporary fluctuations
and imbalances in the availability of physician services.5
evived debates about the adequacy of physician supply
are occurring during an imbalance between patients seeking medical care and
physician capacity. Yet, people on both sides of the debate agree that physician
supply decisions should reflect long-term needs and not temporary fluctuations
and imbalances in the availability of physician services.5
Currently, the U.S. health care marketplace is in transition from managed care restrictions such as gatekeeping and preauthorization to increased cost sharing for those who seek care. Although fewer managed care restrictions may have prompted people to seek more care and physicians to provide more care, physician capacity constraints may ease if people seek less care when faced with higher out-of-pocket costs.
The relative prominence of primary and specialty care may shift over time as well.When managed care plans’ use of primary care physicians as gatekeepers swept the country in the early 1990s, the emphasis shifted away from specialist care to primary care.6 As the number of people in tightly managed care increased, use of specialists was expected to fall. Estimates based on specialist-to-patient ratios in health maintenance organizations forecast a serious oversupply of specialists.7 With fewer managed care restrictions limiting access to specialists, more people may seek specialist care, either directly or through their primary caregiver, but higher out-of-pocket costs may temper how often they seek specialty care.
Back to Top
Data Source
![]() his Tracking Report presents findings from
the HSC Community Tracking Study Physician
Survey, a nationally representative telephone
survey of physicians involved in direct patient
care in the continental United States conducted
in 1996-97, 1998-99 and 2000-01. For discussion
and presentation, we refer to a single calendar
year of the survey (1997, 1999 and 2001). The
sample of physicians was drawn from the
American Medical Association and the American
Osteopathic Association master files and included
active, nonfederal, office- and hospital-based
physicians who spent at least 20 hours per week
in direct patient care. Residents and fellows
were excluded. Each round of the survey contains
information on about 12,000 physicians, and the
response rates ranged from 59 percent to 65 percent.
his Tracking Report presents findings from
the HSC Community Tracking Study Physician
Survey, a nationally representative telephone
survey of physicians involved in direct patient
care in the continental United States conducted
in 1996-97, 1998-99 and 2000-01. For discussion
and presentation, we refer to a single calendar
year of the survey (1997, 1999 and 2001). The
sample of physicians was drawn from the
American Medical Association and the American
Osteopathic Association master files and included
active, nonfederal, office- and hospital-based
physicians who spent at least 20 hours per week
in direct patient care. Residents and fellows
were excluded. Each round of the survey contains
information on about 12,000 physicians, and the
response rates ranged from 59 percent to 65 percent.
More detailed information on survey methodology can be found at www.hschange.org.
Back to Top
Notes
Back to Top
Supplementary Tables
Supplementary Table
1: Average Number of Visits Reported per Person per Year and Percent of
Patients with Any Visit During the Year, by Type of Practitioner
Supplementary Table 2:
Proportion of Physicians Willing to Accept New Patients by Specialty
TRACKING REPORTS are published by the Center for Studying Health System Change.
President: Paul B. Ginsburg
Contact HSC at:
600 Maryland Avenue, SW Suite 550
Washington, DC 20024-2512
Tel: (202) 554-7549 (for publication information)
Tel: (202) 484-5261 (for general HSC information)
Fax: (202) 484-9258
www.hschange.org