
| January 2003 Journal Article Journal of Ambulatory Care Management |
||
Kinder and Gentler: Physicians and Managed Care, 1997-2001
Tracking Report No. 5
November 2002
Bradley C. Strunk, James D. Reschovsky
![]() espite the managed care backlash, an overwhelming majority
of U.S. physicians continue to contract with managed care
health plans. In fact, according to a new Center for Studying
Health System Change (HSC) study, between 1997 and 2001
physicians reported a modest increase in the proportion
of practice revenue from managed care contracts and the
average number of contracts. At the same time, the nature
of physicians’ relationships with health plans changed, with a
significant decrease in plans’ use of capitation, or fixed monthly
payments for each patient regardless of the amount of care
provided. Meanwhile, physician practices moved away from
using direct financial incentives to influence doctors’ clinical
decision making, but did experience an increase in the overall
influence of treatment guidelines and other practices commonly
associated with managed care.
espite the managed care backlash, an overwhelming majority
of U.S. physicians continue to contract with managed care
health plans. In fact, according to a new Center for Studying
Health System Change (HSC) study, between 1997 and 2001
physicians reported a modest increase in the proportion
of practice revenue from managed care contracts and the
average number of contracts. At the same time, the nature
of physicians’ relationships with health plans changed, with a
significant decrease in plans’ use of capitation, or fixed monthly
payments for each patient regardless of the amount of care
provided. Meanwhile, physician practices moved away from
using direct financial incentives to influence doctors’ clinical
decision making, but did experience an increase in the overall
influence of treatment guidelines and other practices commonly
associated with managed care.
- The Rise and Fall of Managed Care?
- Risk Contracting Declines
- Use of Financial Incentives
- Impact of Care Management Tools Grows
- Loosening the Grip
- Data Sources
- Notes
The Rise and Fall of Managed Care?
![]() anaged care plans achieved remarkable success in slowing
health care cost trends in the mid-1990s. The reversal from
high cost growth earlier in the decade was due, in part, to plans
tightly managing access to care through such tools as primary
care physicians (PCPs) acting as gatekeepers to specialists,
requiring hospital admission preauthorizations and limiting
patients’ choice of doctors and hospitals through narrow
provider networks. But consumers and physicians rebelled
against plans’ increased oversight and care restrictions.
anaged care plans achieved remarkable success in slowing
health care cost trends in the mid-1990s. The reversal from
high cost growth earlier in the decade was due, in part, to plans
tightly managing access to care through such tools as primary
care physicians (PCPs) acting as gatekeepers to specialists,
requiring hospital admission preauthorizations and limiting
patients’ choice of doctors and hospitals through narrow
provider networks. But consumers and physicians rebelled
against plans’ increased oversight and care restrictions.
Despite this backlash, and scattered reports of physicians opting out of managed care contracts altogether, more than nine of 10 physicians in 1997 and 2001 owned or were members of a medical practice that had at least one contract with a managed care plan (Figure 1). Among physicians with managed care plan contracts, total average practice revenue from managed care plans actually increased to 46 percent in 2001, up from 43 percent in 1997 (see Table 1). Primary care physicians continued to receive a greater share of total revenue from managed care plans in 2001 than did specialists (49.7% versus 43.1%).
Moreover, the average number of managed care plan contracts among physicians with at least one such contract increased from 12.4 in 1997 to 13.1 in 2001, probably reflecting plans’ response to consumer desires for broader physician networks. This small increase may actually understate the degree to which managed care plans broadened their provider networks. There was considerable consolidation among insurers between 1997 and 2001, and this would be expected to reduce the average number of physicians’ managed care plan contracts.
In recent years, enrollment in preferred provider organizations (PPOs) has grown substantially at the expense of health maintenance organization (HMO) enrollment.1 This is likely due to PPOs’ tendency to place fewer restrictions on health care service use and allow more direct access to specialists. Despite this enrollment shift, primary care physicians in 2001 acted as gatekeepers for 44.6 percent of their patients, 3.6 percentage points greater than in 1997. Nearly all of this growth occurred before 1999, however, when HMO enrollment was still expanding. From 1999 to 2001, the use of primary care physicians acting as gatekeepers held steady.2
Figure 1Physicians and Managed Care Plan Contracts, 2001
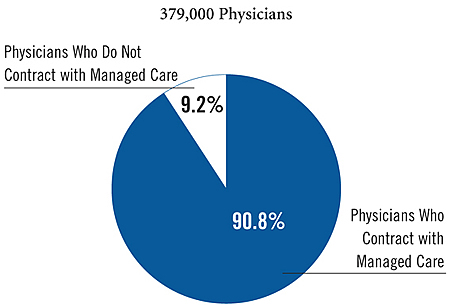
Source: HSC Community Tracking Study Physician Survey
Note: Estimates for 2001 are not statistically different from 1997.
| TABLE 1: Level of Physician Participation with Managed Care Health Plans | |||
1997 |
1999 |
2001 |
|
| Average Percentage of Practice Revenue from Managed Care Plan | 42.7% |
46.0%* |
45.8% # |
| PCPs | 47.2 |
50.1* |
49.7 # |
| Specialists | 39.8 |
43.3* |
43.1 # |
| Average Number of Managed Care Plan Contracts | 12.4 |
13.1* |
13.1 # |
| PCPs | 10.9 |
11.1 |
11.4 |
| Specialists | 13.3 |
14.4* |
14.3 # |
| Average Percentage of Patients for Whom PCPs Serve as Gatekeeper | 41.0% |
44.1%* |
44.6% # |
| Percentage of PCPs Who Serve as Gatekeeper for more than 50% of patients | 31.7% |
36.5%* |
36.9% # |
| Note: Physicians with no
managed care plan contracts are excluded. * Change from previous period is statistically significant at p<.05. # Change from 1997 to 2001 is statistically significant at p<.05. Source: HSC Community Tracking Study Physician Survey |
|||
Back to Top
Risk Contracting Declines
![]() lthough managed care plans maintained a strong role in
the practices of most doctors, the nature of physicians’ relationships with
health plans changed between 1997 and 2001, with a significant decrease in health
plans’ use of capitation, or fixed per-patient, monthly payments. Also known
as risk contracting, capitation offers strong financial incentives to physicians
to limit the amount of care provided to patients.
lthough managed care plans maintained a strong role in
the practices of most doctors, the nature of physicians’ relationships with
health plans changed between 1997 and 2001, with a significant decrease in health
plans’ use of capitation, or fixed per-patient, monthly payments. Also known
as risk contracting, capitation offers strong financial incentives to physicians
to limit the amount of care provided to patients.
Among physicians who owned or were members of a practice with at least one managed care plan contract, the proportion whose practice derived at least some revenue from capitation dropped about 9 percentage points to 48.6 percent in 2001 (see Table 2). This trend was evident among both primary care physicians and specialists, although specialists continued to be much less likely than primary care physicians to be in a practice receiving capitated payments—36.4 percent versus 66.7 percent in 2001. Among physicians whose practice did receive capitated payments, the portion of practice revenue from capitation remained unchanged between 1997 and 2001 after rising slightly in 1999.
| TABLE 2: Use of Capitated Payments | |||
1997 |
1999 |
2001 |
|
| Physicians with Managed Care Contracts | |||
| Derive at Least Some Revenue from Capitation | 57.4% |
58.7% |
48.6%* # |
| PCPs | 76.6 |
76.8 |
66.7* # |
| Specialists | 45.0 |
46.8 |
36.4* # |
| Physicians Who Derive at Least Some Revenue from Capitation | |||
| Average Percentage of Practice Revenue that Is Capitated | 29.7 |
31.2* |
29.7* |
| PCPs | 32.4 |
34.4* |
32.2* |
| Specialists | 26.8 |
27.8 |
26.6 |
| * Change from previous period is statistically significant at p<.05. # Change from 1997 to 2001 is statistically significant at p<.05. Source: HSC Community Tracking Study Physician Survey |
|||
Back to Top
Use of Financial Incentives
![]() oth health plans and physician practices sometimes tie
specific financial incentives to overall compensation to
influence physicians’ clinical decision making. These
incentives include profiling—comparing a physician’s
pattern of medical resource use with those of other physicians—results of patient satisfaction surveys and quality
of care measures such as rates of preventive care.
oth health plans and physician practices sometimes tie
specific financial incentives to overall compensation to
influence physicians’ clinical decision making. These
incentives include profiling—comparing a physician’s
pattern of medical resource use with those of other physicians—results of patient satisfaction surveys and quality
of care measures such as rates of preventive care.
Between 1997 and 2001, less than a third of all physicians had their overall compensation tied to specific financial incentives at the practice level (see Table 3). Use of profiling tied to physicians’ compensation declined to 12.2 percent in 2001, from 15.6 percent of physicians in 1997. Primary care physicians experienced a proportionally greater decline (25%) than did specialists (19%).
There was no statistically significant change from 1997 to 2001 in the extent to which physicians’ compensation was tied to patient satisfaction surveys or quality measures. Nearly one-quarter (23.6%) of physicians reported that patient satisfaction survey results were used in determining their compensation in 2001, and about 17 percent of physicians reported that specific measures of quality of care, such as rates of preventive care services for their patients, were used in determining compensation. Primary care physicians were more likely to be subject to these types of incentives than were specialists (29.4% versus 19.8% for patient satisfaction incentives, and 23.8% versus 13.1% for quality measure incentives).
| TABLE 3: Use of Financial Incentives | |||
Physicians Subject
to Incentive1 |
|||
1997 |
1999 |
2001 |
|
| Profiling | |||
| All Physicians | 15.6% |
14.4%* |
12.2%* # |
| PCPs | 20.4 |
20.0 |
15.3* # |
| Specialists | 12.4 |
10.8* |
10.1 # |
| Patient Satisfaction Surveys | |||
| All Physicians | 23.2 |
24.5* |
23.6 |
| PCPs | 29.4 |
32.0* |
29.4* |
| Specialists | 19.1 |
19.8 |
19.8 |
| Quality Measures | |||
| All Physicians | 18.5 |
18.9 |
17.3* |
| PCPs | 25.3 |
26.3 |
23.8* |
| Specialists | 14.0 |
14.3 |
13.1 |
| At Least One of the Above Three Incentives | |||
| All Physicians | 31.5 |
32.1 |
29.9* # |
| PCPs | 38.9 |
41.2* |
37.2* |
| Specialists | 26.4 |
26.4 |
25.1 |
| 1 Excludes full owners of solo practices. * Change from previous period is statistically significant at p<.05. # Change from 1997 to 2001 is statistically significant at p<.05. Source: HSC Community Tracking Study Physician Survey |
|||
Back to Top
Impact of Care Management Tools Grows
![]() hile relatively few physicians are subject to explicit
financial incentives, such tools as profiling, patient satisfaction surveys
and treatment guidelines have broader applications for care management. Over
time, the influence of these tools on physicians’ practice of medicine appears
to be growing, regardless of whether they are tied to compensation. 3
hile relatively few physicians are subject to explicit
financial incentives, such tools as profiling, patient satisfaction surveys
and treatment guidelines have broader applications for care management. Over
time, the influence of these tools on physicians’ practice of medicine appears
to be growing, regardless of whether they are tied to compensation. 3
Between 1997 and 2001, the proportion of physicians reporting that feedback from patient satisfaction surveys had a "very large," "large" or "moderate" effect on their practice of medicine increased by nearly 4 percentage points to 61.6 percent (see Table 4). The effect of profiling increased as well, but only among primary care physicians. In 2001, 40.1 percent of primary care physicians reported that profiling affected their practice of medicine, compared with just over 37 percent in 1997. Specialists remained less likely than primary care physicians to be affected by profiling, with 30.4 percent affected in 2001.
Treatment guidelines promoted by government and professional medical organizations signal a growing trend toward evidence-based medicine, and managed care plans often encourage physicians to consider guidelines in their medical practice. Between 1997 and 2001, the number of conditions for which treatment guidelines were developed grew, and the percentage of physicians reporting that treatment guidelines had a "very large,""large" or "moderate" effect on their practice of medicine increased by more than 10 percentage points to 56.2 percent. The pro-portion of primary care physicians affected by treatment guidelines increased 15 percentage points, to 60.7 percent in 2001, while the percentage of specialists affected by guidelines increased over 7 percentage points, to 53.2 percent over the same period.
| TABLE 4: Effect of Care Management Tools | |||
Physicians Affected1 |
|||
1997 |
1999 |
2001 |
|
| Profiling | |||
| All Physicians | 33.3% |
32.2% |
34.3%* |
| PCPs | 37.1 |
35.9 |
40.1* # |
| Specialists | 30.8 |
29.8 |
30.4 |
| Patient Satisfaction Surveys | |||
| All Physicians | 58.0 |
57.8 |
61.6* # |
| PCPs | 58.4 |
57.9 |
62.9* # |
| Specialists | 57.8 |
57.8 |
60.8* # |
| Treatment Guidelines | |||
| All Physicians | 45.9 |
48.7* |
56.2* # |
| PCPs | 45.7 |
52.1* |
60.7* # |
| Specialists | 46.0 |
46.6 |
53.2* # |
| At Least One of the Above Three Tools | |||
| All Physicians | 76.1 |
76.7 |
80.4* # |
| PCPs | 76.6 |
78.2* |
82.8* # |
| Specialists | 75.7 |
75.7 |
78.9* # |
| 1 Data are presented as the percentage of physicians responding that the care
management technique had a "very large," "large" or "moderate" effect on
their practice of medicine. * Change from previous period is statistically significant at p<.05. # Change from 1997 to 2001 is statistically significant at p<.05. Source: HSC Community Tracking Study Physician Survey |
|||
Back to Top
Loosening the Grip
![]() he managed care backlash has altered the relationship
between health plans and physicians—not toward less managed care, but,
rather, to a kinder, gentler managed care. Managed care’s loosened grip on physicians
is likely a contributing factor to a return to double-digit health care spending
increases in 2001.4 To the extent health plans are
introducing new ways to influence physicians’ clinical decision making today,
there are signs that the focus is on quality, i.e., rewarding physicians who
meet certain care standards. An example is the Pay for Performance initiative
launched recently by six California insurers where physicians receive additional
payments for meeting quality measures.
he managed care backlash has altered the relationship
between health plans and physicians—not toward less managed care, but,
rather, to a kinder, gentler managed care. Managed care’s loosened grip on physicians
is likely a contributing factor to a return to double-digit health care spending
increases in 2001.4 To the extent health plans are
introducing new ways to influence physicians’ clinical decision making today,
there are signs that the focus is on quality, i.e., rewarding physicians who
meet certain care standards. An example is the Pay for Performance initiative
launched recently by six California insurers where physicians receive additional
payments for meeting quality measures.
Unlike the 1990s, when health plans’ cost-containment efforts focused on lower provider payments and influencing physician behavior, the emphasis today appears to be on influencing patient behavior through greater cost sharing in the form of deductibles, coinsurance and copayments. Continued cost pressures, the limits of a patient-focused approach and the possibility of a backlash from patients, however, may bring the spotlight back to ways to influence physicians’ medical decisions.
Back to Top
Data Sources
![]() his Tracking Report presents findings from the HSC Community
Tracking Study Physician Survey, a nationally representative telephone survey
of physicians involved in direct patient care in the continental United States
conduct-ed in 1996-97, 1998-99 and 2000-01. For discussion and presentation,
we refer to a single calendar year of the survey (1997, 1999 and 2001). The
sample of physicians was drawn from the American Medical Association and the
American Osteopathic Association master files and included active, nonfederal,
office- and hospital-based physicians who spent at least 20 hours a week in
direct patient care. Residents and fellows were excluded. Each round of the
survey contains information on approximately 12,000 physicians, and the response
rate ranged from 60 percent to 65 percent.
his Tracking Report presents findings from the HSC Community
Tracking Study Physician Survey, a nationally representative telephone survey
of physicians involved in direct patient care in the continental United States
conduct-ed in 1996-97, 1998-99 and 2000-01. For discussion and presentation,
we refer to a single calendar year of the survey (1997, 1999 and 2001). The
sample of physicians was drawn from the American Medical Association and the
American Osteopathic Association master files and included active, nonfederal,
office- and hospital-based physicians who spent at least 20 hours a week in
direct patient care. Residents and fellows were excluded. Each round of the
survey contains information on approximately 12,000 physicians, and the response
rate ranged from 60 percent to 65 percent.
Back to Top
Notes
| 1. | Gabel, Jon, et al., "Job-Based Health Benefits in 2002: Some Important Trends," Health Affairs, Vol. 21, No. 5 (September/October 2002). |
| 2. | These trends mirror those indicated by the HSC Community Tracking Study Household Survey. |
| 3. | Although trends are similar, physicians for whom profiling or patient satisfaction surveys are tied to compensation are substantially more likely to report that these tools have a "moderate" to "very large" effect on their practice of medicine than are physicians for whom these tools are not linked to compensation. |
| 4. | Strunk, Bradley C., Paul B. Ginsburg and Jon R. Gabel, "Tracking Health Care Costs: Growth Accelerates Again in 2001," Health Affairs, Web-exclusive publication (Sept. 25, 2002), www.healthaffairs.org. |
Back to Top
TRACKING REPORTS are published by the Center for Studying Health System Change.
President: Paul B. Ginsburg
Director of Public Affairs: Richard Sorian
Editor: The Stein Group
For additional copies or to be added to the mailing list, contact HSC at:
600 Maryland Avenue, SW
Suite 550
Washington, DC 20024-2512
Tel: (202) 554-7549 (for publication information)
Tel: (202) 484-5261 (for general HSC information)
Fax: (202) 484-9258
www.hschange.org