
Working Families' Health Insurance Coverage, 1997-2001
Tracking Report No. 4
August 2002
Bradley C. Strunk, James D. Reschovsky
![]() espite a booming U.S. economy, falling unemployment and
moderate health insurance premium growth, the percentage of
working Americans and their families with employer-sponsored
health insurance failed to increase substantially between 1997
and 2001, according to findings from the Center for Studying
Health System Change (HSC) Community Tracking Study
Household Survey. There were, however, dramatic changes in
the insurance status of people who lacked access to or did not
take up employer coverage: fewer uninsured, more public
program enrollment and a decline in coverage by individual
insurance and other sources. While the State Children’s Health
Insurance Program (SCHIP) clearly reduced uninsurance
among low-income children, evidence also suggests a fair
amount of substitution of public insurance for private coverage.
espite a booming U.S. economy, falling unemployment and
moderate health insurance premium growth, the percentage of
working Americans and their families with employer-sponsored
health insurance failed to increase substantially between 1997
and 2001, according to findings from the Center for Studying
Health System Change (HSC) Community Tracking Study
Household Survey. There were, however, dramatic changes in
the insurance status of people who lacked access to or did not
take up employer coverage: fewer uninsured, more public
program enrollment and a decline in coverage by individual
insurance and other sources. While the State Children’s Health
Insurance Program (SCHIP) clearly reduced uninsurance
among low-income children, evidence also suggests a fair
amount of substitution of public insurance for private coverage.
- Running in Place
- Employer Coverage Decline Levels Off
- Working Families Without Employer Coverage
- Covering Kids: A Success Story
- Running on Empty?
- Data Source
- Notes
Running in Place
![]() he combination of strong economic growth, falling
unemployment and a tight job market suggests that
the late 1990s should have cultivated a climate conducive
to helping more working families obtain employer-sponsored
insurance. Annual increases in insurance
premiums were low during most of this period, although
they rose to double digits by 2001.1
This positive environment suggests more employers should have provided
health benefits to attract and retain workers.
he combination of strong economic growth, falling
unemployment and a tight job market suggests that
the late 1990s should have cultivated a climate conducive
to helping more working families obtain employer-sponsored
insurance. Annual increases in insurance
premiums were low during most of this period, although
they rose to double digits by 2001.1
This positive environment suggests more employers should have provided
health benefits to attract and retain workers.
Yet the proportion of people in working families with employer-sponsored insurance held steady between 1997 and 2001.2 Of the 189 million nonelderly people in working families in 2001, 77.5 percent, or 146 million, had employer coverage, a proportion that remained statistically unchanged between 1997 and 20013 (see Table 1). And about 12 percent of Americans in working families, or about 22 million people, were uninsured in 2001, a modest decline from 1997. Growing enrollment in public insurance programs such as SCHIP drove the slight decline in the uninsurance rate among Americans in working families. There are signs, however, that the gain in public insurance was not drawn exclusively from the ranks of the uninsured but also came from those with private group and individual insurance.
| TABLE 1: Health Insurance Status of America’s Working Families | ||||
People in Working
Families |
||||
1997 |
1999 |
2001 |
Change 1997-2001 |
|
| Insurance Status | ||||
| Employer-Sponsored Insurance1 | 76.8% |
76.6% |
77.5% |
+0.7% |
| Access Rate2 | 82.7 |
82.6 |
84.0* |
+1.3 # |
| Take-Up Rate | 90.1 |
90.1 |
90.0 |
-0.1 |
| Individual Insurance | 4.5 |
4.1 |
3.7 |
-0.8 # |
| Public Insurance | 5.8 |
6.4* |
7.2 |
+1.4 # |
| Uninsured | 13.0 |
12.8 |
11.6* |
-1.4 # |
| Total # of People (in millions) | 181.7 |
188.5 |
189.0 |
|
| 1 In addition to traditional employer coverage,
this includes military insurance, such as CHAMPUS, as well as coverage from
a previous employer, such as COBRA or retiree coverage. 2 The product of the access and take-up rates does not exactly match the percent of people with employer-sponsored insurance because the latter includes those with employer-sponsored insurance from a previous employer. * Change from previous period is statistically significant at p<.05. # Change from 1997 to 2001 is statistically significant at p<.05. Source: HSC Community Tracking Study Household Survey |
||||
Back to Top
Employer Coverage Decline Levels Off
![]() ather than expanding employer coverage, the economic
boom’s legacy could well turn out to be a short-lived
interruption of the long and steady decline in the
proportion of Americans with employer-sponsored
insurance. The percent of nonelderly Americans covered
by employers gradually declined, and the number
of uninsured persons rose, for most of the period from
the mid-1980s to the mid-1990s.4
ather than expanding employer coverage, the economic
boom’s legacy could well turn out to be a short-lived
interruption of the long and steady decline in the
proportion of Americans with employer-sponsored
insurance. The percent of nonelderly Americans covered
by employers gradually declined, and the number
of uninsured persons rose, for most of the period from
the mid-1980s to the mid-1990s.4
With the U.S. economy now struggling to recover from an economic slowdown, unemployment rising and health insurance premiums growing rapidly, the outlook for employer coverage expansion is tenuous at best. Those without employer coverage also may find it more difficult to gain access to public coverage as tight budgets lead state and federal governments to constrain eligibility.
Back to Top
Working Families Without Employer Coverage
![]() o gain employer coverage, working families must first
have access to it by having a current employer that offers health insurance
and then meeting eligibility requirements, such as working a minimum number
of hours. In 2001, 84 percent of Americans in working families had access to
employer coverage. This was only slightly higher—1.3 percentage points—than
in 1997. People in working families with access to employer coverage also must
choose whether or not to take up a current employer’s offer. The take-up rate
for people in eligible working families held steady between 1997 and 2001, at
about 90 percent.
o gain employer coverage, working families must first
have access to it by having a current employer that offers health insurance
and then meeting eligibility requirements, such as working a minimum number
of hours. In 2001, 84 percent of Americans in working families had access to
employer coverage. This was only slightly higher—1.3 percentage points—than
in 1997. People in working families with access to employer coverage also must
choose whether or not to take up a current employer’s offer. The take-up rate
for people in eligible working families held steady between 1997 and 2001, at
about 90 percent.
The concepts of access and take up help to explain why some people in working families do not obtain employer coverage. While about three-quarters of the 189 million people in working families in 2001 had access to and took up employer coverage from a current employer, another 8 percent, or 16 million people in working families, had access to but did not take up employer coverage. A third group—30 million people in working families, or 16 percent—simply does not have access to employer coverage (see Figure 1).
The 46 million people in working families who either lack access to or do not take up employer coverage are the focus of a great deal of policy debate. They tend to have low incomes—below 200 percent of poverty, or about $35,000 a year for a family of four in 2001—and are more likely to describe themselves as being in fair or poor health. They also are more likely to work for—or have a family member who works for—a small employer (with fewer than 100 employees). In lieu of employer coverage, these people have three main alternatives: They can buy individual insurance; some can enroll in public programs like Medicaid or SCHIP; or they can go without coverage.
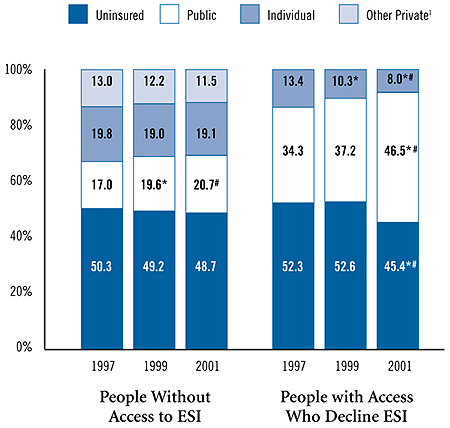
Insurance coverage among people in working families who lack access to or do not take up employer coverage changed between 1997 and 2001, primarily as a result of SCHIP. Among the 30 million people in working families who lacked access to employer coverage in 2001, 49 percent were uninsured, 21 percent enrolled in public programs, 19 percent bought individual coverage and 11 percent obtained other private insurance5 (see Figure 2). Between 1997 and 2001, the number of uninsured, individually insured and those with other coverage shrank slightly, but the changes in each were not statistically significant. In that same period, enrollment in public programs for this group grew from 17 percent to 21 percent.
Among the 16 million people who declined employer coverage in 2001, 45 percent were uninsured, 47 percent were enrolled in public programs and 8 percent bought individual policies. There was a striking change in the insurance status of these Americans between 1997 and 2001. The proportion enrolled in public programs jumped 13 percentage points, from 34 percent in 1997 to 47 percent in 2001, with most of the change occurring between 1999 and 2001. At the same time, the percentage of people who declined employer coverage and were uninsured fell by 7 percentage points, from 52 percent to 45 percent, again mostly during 1999-2001. The proportion purchasing individual insurance fell 5 percentage points, from 13 percent to 8 percent.
FIGURE 1: America’s Working Families’ Access to and Take Upof Employer-Sponsored Insurance (ESI), 2001
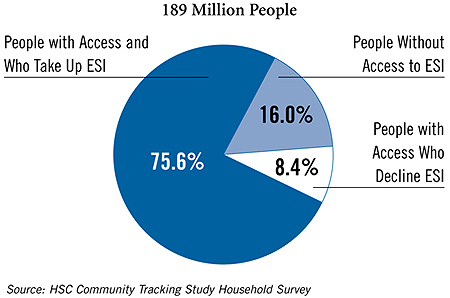
FIGURE 2: Insurance Status of Nonelderly People in Working
Families Without Access to or Who Decline ESI
1 Most likely retiree coverage from a previous employer or group coverage via COBRA.
* Change from previous period is statistically significant at p<.05.
# Change from 1997 to 2001 is statistically significant at p<.05.
Source: HSC Community Tracking Study Household Survey
Back to Top
Covering Kids: A Success Story
![]() n an otherwise static period, there was a dramatic
change in coverage of children from low-income
working families. The proportion of uninsured children
fell 4.9 percentage points, from 20.4 percent in 1997 to
15.5 percent in 2001. Enrollment of children in public
programs rose 10.3 percentage points, from 21 percent
in 1997 to 31.3 percent in 2001. And the proportion of
children with employer coverage dropped 4.4 percentage
points, from 55.4 percent to 51 percent (see Table 2).
n an otherwise static period, there was a dramatic
change in coverage of children from low-income
working families. The proportion of uninsured children
fell 4.9 percentage points, from 20.4 percent in 1997 to
15.5 percent in 2001. Enrollment of children in public
programs rose 10.3 percentage points, from 21 percent
in 1997 to 31.3 percent in 2001. And the proportion of
children with employer coverage dropped 4.4 percentage
points, from 55.4 percent to 51 percent (see Table 2).
SCHIP, enacted in 1997, targets low-income, uninsured children. Concerned that SCHIP might simply lead to substitution of public coverage for existing private coverage, Congress required states to put safeguards in place. These crowd-out protections vary by state, but they most commonly require children with employer-sponsored coverage to be uninsured for a certain period (e.g., six months) before becoming eligible for SCHIP.
Evidence suggests, however, that the growth in children’s public coverage was not solely from the ranks of the uninsured, but that some substitution of public for private coverage occurred. While the percentage of children in low-income working families with access to employer-sponsored coverage remained unchanged at about 70 percent between 1997 and 2001, the percentage of children whose families took up employer coverage fell from 51.8 percent in 1997 to 48 percent in 2001 (see Table 3).
The number of children in low-income working families enrolled in public programs grew by about 2 million between 1997 and 2001, with a third to a half of the increase coming from those who could have had employer coverage.6 The fact that these trends were not seen among parents of low-income children suggests SCHIP was the major factor.
Some degree of substitution of SCHIP coverage for employer coverage is inevitable and not necessarily bad. Private insurance premiums pose a substantial financial burden on most low-income working families, and substituting public coverage reduces this burden.
| TABLE 2: Health Insurance Status of Children (Ages 0-18) in Low-Income1 Working Families | ||||
Children in
Low-Income Working Families |
||||
1997 |
1999 |
2001 |
Change 1997-2001 |
|
| Insurance Status | ||||
| Employer-Sponsored Insurance2 | 55.4% |
48.3%* |
51.0% |
-4.4% # |
| Individual Insurance | 3.3 |
2.8 |
2.2 |
-1.1 |
| Public Insurance | 21.0 |
27.9* |
31.3 |
+10.3 # |
| Uninsured | 20.4 |
21.0 |
15.5* |
-4.9 # |
| Total # of Children (in millions) | 21.4 |
22.1 |
19.1 |
|
| 1 Family income is less than 200 percent
of poverty. 2 Includes coverage from a parent’s current employer, military insurance, such as CHAMPUS, and coverage from a parent’s previous employer, such as COBRA. * Change from previous period is statistically significant at p<.05. # Change from 1997 to 2001 is statistically significant at p<.05. Source: HSC Community Tracking Study Household Survey |
||||
| TABLE 3: Access, Take-Up and Coverage Trends Among Children (Ages 0-18) in Low-Income1 Working Families | ||||
Children in
Low-Income Working Families |
||||
1997 |
1999 |
2001 |
Change 1997-2001 |
|
| Children with Access to ESI | 69.7% |
65.0%* |
69.7%* |
0.0% |
| Take Up | 51.8 |
45.0* |
48.0 |
-3.8 |
| No Take Up | 17.9 |
20.1 |
21.7 |
+3.8 # |
| Individual Insurance | 0.9 |
0.8 |
0.5 |
-0.4 # |
| Public Insurance | 8.7 |
11.5* |
15.3* |
+6.6 # |
| Uninsured | 8.3 |
7.7 |
6.0* |
-2.3 # |
| Children Lacking Access to ESI | 30.3 |
35.0* |
30.3* |
0.0 |
| Individual Insurance | 2.3 |
2.0 |
1.7 |
-0.6 |
| Other Private | 3.6 |
3.4 |
3.0 |
-0.6 |
| Public Insurance | 12.3 |
16.4* |
16.1 |
+3.8 # |
| Uninsured | 12.2 |
13.2 |
9.5* |
-2.7 # |
| 1 Family income is less than 200 percent
of poverty. * Change from previous period is statistically significant at p<.05. # Change from 1997 to 2001 is statistically significant at p<.05. Source: HSC Community Tracking Study Household Survey |
||||
Back to Top
Running on Empty?
![]() he failure of the economic boom to expand employer-based
coverage for working families significantly is ominous.
The softening of the U.S. economy and the return
to double-digit health insurance premium increases are
likely to weaken employers’ ability to offer health insurance
and lead them to shift a greater share of the cost to
employees. Combined with slower wage growth, this will
reduce workers’ willingness to take up coverage offers.
The return of federal and state budget deficits may
presage cuts in such public programs as SCHIP and
Medicaid.
he failure of the economic boom to expand employer-based
coverage for working families significantly is ominous.
The softening of the U.S. economy and the return
to double-digit health insurance premium increases are
likely to weaken employers’ ability to offer health insurance
and lead them to shift a greater share of the cost to
employees. Combined with slower wage growth, this will
reduce workers’ willingness to take up coverage offers.
The return of federal and state budget deficits may
presage cuts in such public programs as SCHIP and
Medicaid.
Ultimately, the legacy of the 1990s’ boom may be a short-term interruption in greater numbers of uninsured Americans and fewer employers offering coverage. This suggests that relying on economic growth alone to reduce the number of uninsured is unlikely to be effective in achieving substantial expansion of employer coverage. Short of an employer mandate to offer health benefits or universal public coverage, efforts to increase insurance coverage among low-income working individuals and families will require substantial government funding, whether the approach chosen involves new or expanded public insurance programs or subsidies to purchase private insurance.
Back to Top
Data Source
![]() his Tracking Report presents findings from the HSC Community
Tracking Study Household Survey, a nationally representative telephone survey
of the civilian, noninstitutionalized population conducted in 1996-97, 1998-99
and 2000-01. For discussion and presentation, we refer to a single calendar
year of the survey (1997, 1999 and 2001). Data were supplemented by in-person
interviews of households without telephones to ensure proper representation.
Each round of the survey contains information on about 60,000 people, and response
rates ranged from 60 percent to 65 percent.
his Tracking Report presents findings from the HSC Community
Tracking Study Household Survey, a nationally representative telephone survey
of the civilian, noninstitutionalized population conducted in 1996-97, 1998-99
and 2000-01. For discussion and presentation, we refer to a single calendar
year of the survey (1997, 1999 and 2001). Data were supplemented by in-person
interviews of households without telephones to ensure proper representation.
Each round of the survey contains information on about 60,000 people, and response
rates ranged from 60 percent to 65 percent.
The estimates in this report are representative of nonelderly people in working families. A working family is defined as one in which the total number of hours worked by all adult members of the family is 20 or more per week. We exclude families in which all adult members are self-employed without paid employees as well as people who obtain health insurance from someone outside the family.
If any member of the family has access to employer coverage, then all members are considered to have access. The take-up rate is defined at the person level, since it is possible for some family members to be covered by an employer, while others are uninsured or have other coverage. Insurance status reflects coverage on the day of the interview.
Back to Top
Notes
Back to Top
TRACKING REPORTS are published by the Center for Studying Health System Change.
President: Paul B. Ginsburg
Director of Public Affairs: Richard Sorian
Editor: The Stein Group
For additional copies or to be added to the mailing list, contact HSC at:
600 Maryland Avenue, SW
Suite 550
Washington, DC 20024-2512
Tel: (202) 554-7549 (for publication information)
Tel: (202) 484-5261 (for general HSC information)
Fax: (202) 484-9258
www.hschange.org