# Statistically significant difference between 1997 and 1999 at p< .05.
The information in these graphs comes from the Household and Physician Surveys conducted in 1996-1997 and 1998-1999 as part of HSC’s Community Tracking Study.

Community Report No. 01
Fall 2000
Aaron Katz, Robert E. Hurley, Leslie A. Jackson, Timothy K. Lake, Ashley C. Short, J. Lee Hargraves
- Hospital Systems Still Dominate, Compete at the Margins
- Hospital-Physician Relationships Shift Focus
- Stronger Managed Care Fails to Materialize
- Skepticism Marks Purchaser Strategies
- State Policies Help to Strengthen Safety Net
- Issues to Track
- Indianapolis’ Experience with the Local Health System, 1997 and 1999
- Background and Observations
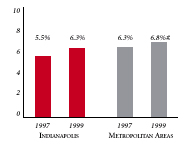
| PERSONS SATISFIED WITH THE HEALTH CARE THEY RECEIVED IN THE LAST 12 MONTHS | PERSONS WHO DID NOT GET NEEDED MEDICAL CARE IN THE LAST 12 MONTHS |
|
|
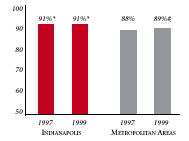
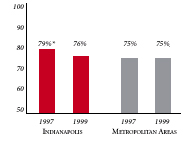
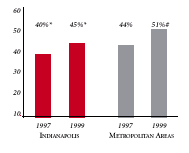
| PHYSICIANS AGREEING THAT IT IS POSSIBLE TO PROVIDE HIGH-QUALITY CARE TO THEIR PATIENTS | PERSONS WITH INSURANCE THAT REQUIRES GATEKEEPING |
|
|
| * Site value is significantly different from the mean for
metropolitan areas over 200,000 population. # Statistically significant difference between 1997 and 1999 at p< .05. The information in these graphs comes from the Household and Physician Surveys conducted in 1996-1997 and 1998-1999 as part of HSC’s Community Tracking Study. |
|
| Indianapolis Demographics | |
| Indianapolis | Metropolitan areas above 200,000 population |
| Population, July 1, 19991 1,536,665 |
|
| Population Change, 1990-19992 | |
| 11% | 8.6% |
| Median Income3 | |
| $27,996 | $27,843 |
| Persons Living in Poverty3 | |
| 11% | 14% |
| Persons Age 65 or Older3 | |
| 12% | 11% |
| Sources: 1. U.S. Bureau of Census, 1999 Community Population Estimates 2. U.S. Bureau of Census, 1990 & 1999 Community Population Estimates 3. Community Tracking Study Household Survey, 1998-1999 |
|
| Health Insurance Status | |
| Indianapolis | Metropolitan areas above 200,000 population |
| Persons under Age 65 with No Health Insurance1 | |
| 14% | 15% |
| Children under Age 18 with No Health Insurance1 | |
| 10% | 11% |
| Employees Working for Private Firms that Offer Coverage2 | |
| 86% | 84% |
| Average Monthly Premium for Self-Only Coverage under Employer-Sponsored Insurance2 | |
| $178 | $181 |
| Sources: 1. Community Tracking Study Household Survey, 1998-1999 2. Robert Wood Johnson Foundation Employer Health Insurance Survey, 1997 |
|
| Health System Characteristics | |
| Indianapolis | Metropolitan areas above 200,000 population |
| Staffed Hospital Beds per 1,000 Population1 | |
| 3.3 | 2.8 |
| Physicians per 1,000 Population2 | |
| 2.5 | 2.3 |
| HMO Penetration, 19973 | |
| 23% | 32% |
| HMO Penetration, 19994 | |
| 23% | 36% |
| Sources: 1. American Hospital Association, 1998 2. Area Resource File, 1998 (includes nonfederal, patient care physicians, except radiologists, pathologists and anesthesiologists) 3. InterStudy Competitive Edge 8.1 4. InterStudy Competitive Edge 10.1 |
|