
High and Varying Prices for Privately Insured Patients Underscore Hospital Market Power
HSC Research Brief No. 27
September 2013
Chapin White, Amelia M. Bond, James D. Reschovsky
Across 13 selected U.S. metropolitan areas, hospital prices for privately insured patients are much higher than Medicare payment rates and vary widely across and within markets, according to a study by the Center for Studying Health System Change (HSC) based on claims data for about 590,000 active and retired nonelderly autoworkers and their dependents. Across the 13 communities, average hospital prices for privately insured patients are about one-and-a-half times Medicare rates for inpatient care and two times what Medicare pays for outpatient care. Within individual communities, prices vary widely, with the highest-priced hospital typically paid 60 percent more for inpatient services than the lowest-priced hospital. The price gap within markets is even greater for hospital outpatient care, with the highest-priced hospital typically paid nearly double the lowest-priced hospital. In contrast to the wide variation in hospital prices for privately insured patients across and within markets, prices for primary care physician services generally are close to Medicare rates and vary little within markets. Prices for specialist physician services, however, are higher relative to Medicare and vary more across and within markets.
Of the 13 markets, five are in Michigan, which has an unusually concentrated private insurance market, with one insurer commanding a 70-percent market share. Despite the presence of a dominant insurer, almost all Michigan hospitals command prices that are higher than Medicare, and some hospitals command prices that are twice what Medicare pays. In the eight markets outside of Michigan, private insurers generally pay even higher hospital prices, with even wider gaps between high- and low-priced hospitals. The variation in hospital and specialist physician prices within communities underscores that some hospitals and physicians have significant market power to command high prices, even in markets with a dominant insurer.
- Peering Under the Veil
- Prices for Five Types of Services
- High and Highly Variable Hospital Prices
- Primary Care Prices Vary Little
- More Variation in Specialists’ Prices
- Making Sense of Price Variation Within Markets
- Unused Insurer Leverage?
- Potential Savings
- Looking Ahead
- Notes
- Data Source
- Supplementary Tables
- Technical Appendix
- Funding Acknowledgement
Peering Under the Veil
![]() he prices that private health plans pay medical providers are opaque, not only to patients, but also to private purchasers.1 While the complexity of medical care contributes to the pricing opaqueness, obfuscation also plays a role. When private insurers negotiate payment rates with medical providers, both parties generally agree to keep the key details secret.2 Employers—and their covered workers and dependents—pay those prices but are not privy to the contract details negotiated on their behalf.
he prices that private health plans pay medical providers are opaque, not only to patients, but also to private purchasers.1 While the complexity of medical care contributes to the pricing opaqueness, obfuscation also plays a role. When private insurers negotiate payment rates with medical providers, both parties generally agree to keep the key details secret.2 Employers—and their covered workers and dependents—pay those prices but are not privy to the contract details negotiated on their behalf.
From aggregate data, it is clear that high prices lie at the heart of the health spending problem in the United States,3 and it is equally clear that private insurers generally pay higher prices than Medicare or Medicaid.4,5 But, little is known about why private prices are higher for some services than for others, and why and how prices vary from provider to provider both across and within markets.
From qualitative analyses, it is clear that provider market power is key in price negotiations and that certain hospitals and physician groups, known as “must-haves,” can extract prices much higher than nearby competitors.6 Previous HSC research also has found quantitative evidence of wide variation in private prices for hospital and physician services within and across markets.7
Moreover, the Centers for Medicare & Medicaid Services (CMS) recently released hospital- and diagnosis-related group, or DRG, data on charges for inpatient and outpatient services.8 While the charge data spotlight wide variation in hospital billing practices, hospital charges do not represent the negotiated prices that private insurers actually pay.
Back to Top
Prices for Five Types of Services
![]() his Research Brief overcomes some of the limitations of previous studies and examines price variation in 13 markets in much more detail than has previously been possible by using 2011 claims data for 590,225 nonelderly active and retired autoworkers and dependents represented by the International Union, UAW, and employed by Chrysler, Ford and General Motors (see Data Source).
his Research Brief overcomes some of the limitations of previous studies and examines price variation in 13 markets in much more detail than has previously been possible by using 2011 claims data for 590,225 nonelderly active and retired autoworkers and dependents represented by the International Union, UAW, and employed by Chrysler, Ford and General Motors (see Data Source).
In this analysis, hospital and physician prices represent the “allowed amount,” meaning the actual total payment to the provider, including amounts from the insurer and from patient cost sharing. Prices are examined for five types of services, representing 71 percent of total spending in the autoworker plans:9
- hospital inpatient—for example, an inpatient hospital stay for a heart attack;
- hospital outpatient—for example, a magnetic resonance imaging (MRI) scan in an outpatient department;
- services provided by primary care physicians—for example, a general internal medicine physician;
- services provided by medical specialists—for example, a cardiologist; and
- services provided by surgical specialists—for example, a thoracic surgeon.
Across the 13 markets, each hospital was assigned two price indexes, one for inpatient services and another for outpatient services. Each physician practice was assigned up to three price indexes, one for services provided by primary care physicians, another for services provided by medical specialists, and another for services provided by surgical specialists.10 Medicare prices are used as a benchmark, and price indexes reflect the ratio of the amount paid by the autoworker plans relative to the amount that Medicare would have paid for the same services.11 A price index of 1.0 indicates that the autoworker plans paid the same amount as Medicare, 1.2 indicates a price 20 percent above Medicare, and so on (see Technical Appendix for more information). Medicare prices incorporate adjustments for the complexity of the services provided and, in principle, are set at a level that reflects the costs of a reasonably efficient provider.
Back to Top
High and Highly Variable Hospital Prices
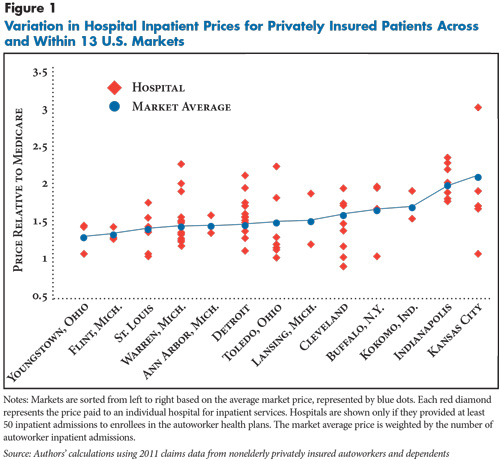
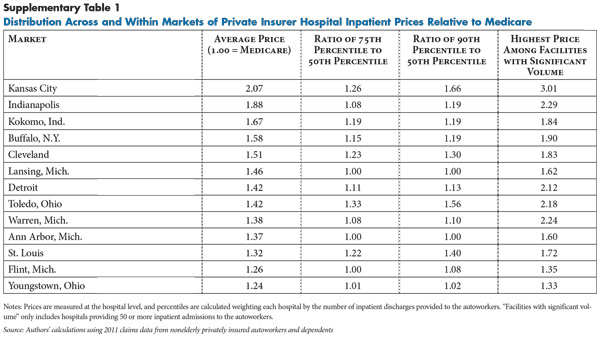
![]() n most of the 13 markets, a wide gap separates the highest- and lowest-priced hospitals. Typically, the highest-priced hospital is paid 60 percent more for inpatient services than the lowest-priced hospital (see Figure 1). The gap is even more extreme in certain markets, such as Kansas City, Cleveland and Toledo. In each of these markets, the highest-priced hospital is paid well above twice as much as the lowest-priced hospital for inpatient services (see Supplementary Table 1).
n most of the 13 markets, a wide gap separates the highest- and lowest-priced hospitals. Typically, the highest-priced hospital is paid 60 percent more for inpatient services than the lowest-priced hospital (see Figure 1). The gap is even more extreme in certain markets, such as Kansas City, Cleveland and Toledo. In each of these markets, the highest-priced hospital is paid well above twice as much as the lowest-priced hospital for inpatient services (see Supplementary Table 1).
Detroit illustrates the wide range of prices paid for hospital care within a single market. More than 100,000 nonelderly autoworkers and their dependents are enrolled in one of the plans in Detroit, and 14 hospitals provided a significant volume of inpatient care to these enrollees—at least 50 admissions each. Among the 14 hospitals, nine had price indexes clustered fairly tightly around the market average of 1.5, or 150 percent of Medicare. But, five hospitals were paid prices at least 15 percent higher than the market average, ranging up to 2.2—or 220 percent of Medicare.
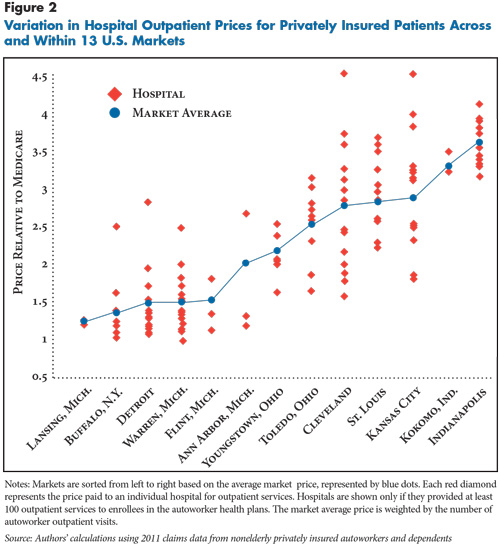
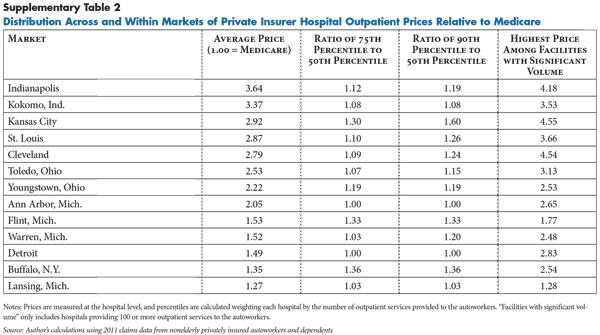
The price variation for hospital outpatient care was even more extreme than for inpatient care. Typically, the highest-priced hospital in a market was paid nearly twice as much for outpatient care as the lowest-priced hospital in the market. Cleveland exhibits the most extreme variation in outpatient prices (see Figure 2). The most expensive Cleveland hospital was paid outpatient prices three times as high as the least expensive hospital. But, wide variation in outpatient prices appears in almost all of the markets (see Supplementary Table 2).
Back to Top
Primary Care Prices Vary Little
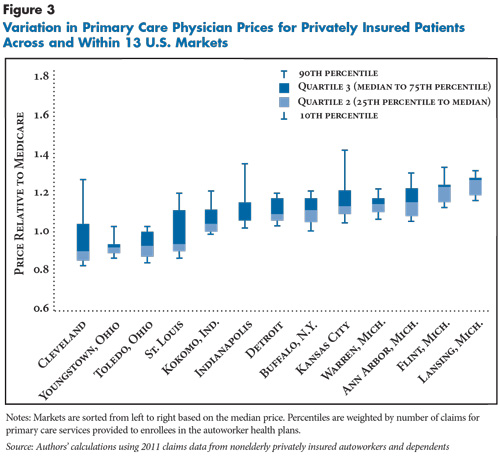
![]() rices for physician primary care services differ from hospital prices in two ways: they tend to be much closer to Medicare—and, in some cases, below—and they vary less within and across markets. In almost all 13 markets, the prices paid to primary care practices fall in a narrow range, typically between 85 percent and 135 percent of Medicare (see Figure 3). Four markets—Cleveland, St. Louis, Indianapolis and Kansas City—have wider primary care price variation, with a few primary care practices receiving prices well above Medicare.
rices for physician primary care services differ from hospital prices in two ways: they tend to be much closer to Medicare—and, in some cases, below—and they vary less within and across markets. In almost all 13 markets, the prices paid to primary care practices fall in a narrow range, typically between 85 percent and 135 percent of Medicare (see Figure 3). Four markets—Cleveland, St. Louis, Indianapolis and Kansas City—have wider primary care price variation, with a few primary care practices receiving prices well above Medicare.
Back to Top
Back to Top
More Variation in Specialists’ Prices
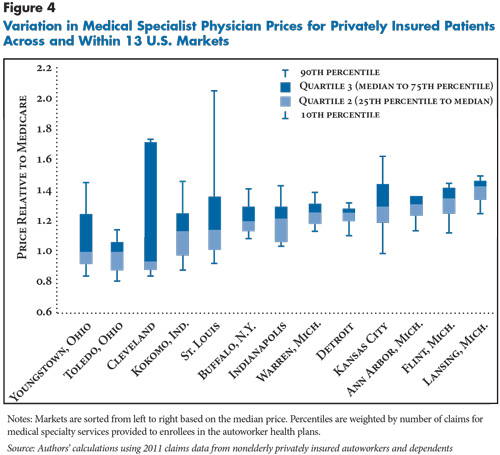
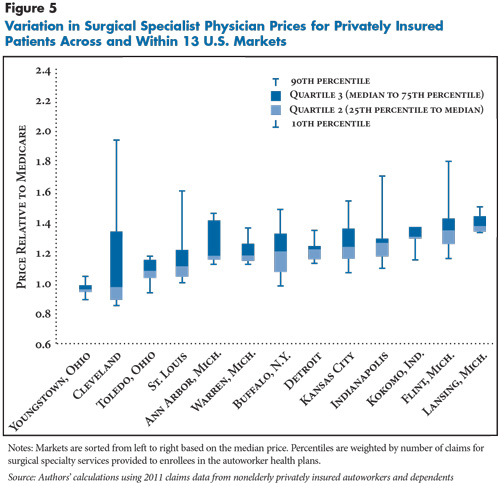
![]() rices for medical and surgical specialty services vary more widely than primary care and tend to be higher relative to Medicare (see Figure 4 and Figure 5). Specialty price indexes generally ranged from below 1.0—less than Medicare—to 1.5 or even higher. Two markets—Cleveland and St. Louis—stand out because highly reimbursed specialty practices receive prices 50 percent or more above the median price in the markets.
rices for medical and surgical specialty services vary more widely than primary care and tend to be higher relative to Medicare (see Figure 4 and Figure 5). Specialty price indexes generally ranged from below 1.0—less than Medicare—to 1.5 or even higher. Two markets—Cleveland and St. Louis—stand out because highly reimbursed specialty practices receive prices 50 percent or more above the median price in the markets.
Specialist physicians tend to provide more complex services than primary care physicians. But that by itself does not explain the different price patterns between primary care and specialists, because differences in the complexity of the services are accounted for in the Medicare benchmark.
Back to Top
Making Sense of Price Variation Within Markets
![]() everal factors can be ruled out as explanations for the wide price variation within markets, including:
everal factors can be ruled out as explanations for the wide price variation within markets, including:
- the costs of doing business—labor costs within each market are about the same;
- the complexity of the services being provided—differences in service complexity are taken into account by benchmarking to Medicare prices, which are adjusted for complexity; and
- the type of coverage—all enrollees are in private plans with similar benefits.
What, then, can explain the price variation? The hospital industry has argued that higher-priced hospitals treat the most complex patients and have higher costs because of their teaching programs and capital investments. While this may explain some variation within a market as riskier patients seek care at tertiary hospitals, benchmarking to Medicare should mitigate this influence. Indeed, many analysts believe that Medicare’s additional payments to hospitals for medical education exceed the additional costs.12
The more likely culprit is variation among providers and private insurers in negotiating leverage. Negotiating leverage depends on the ability to walk away if an agreement cannot be reached. In terms of negotiating leverage, primary care practices fall at the bottom of the heap. Primary care physicians tend to practice solo or in smaller groups, and they are more numerous than specialists and more substitutable, making them the least able to dictate prices to health plans. Primary care physicians are, in economics jargon, price-takers. A private insurer does not need the participation of all primary care physicians in a market. Instead, an insurer needs only enough primary care physicians to provide access to enrollees, and no single primary care practice is needed to reach that threshold. As a result, few, if any, primary care practices can command prices that significantly exceed their competitors’.
The specialty physician market is generally more concentrated, with fewer specialist practices in each specialty than primary care physicians.13 Moreover, specialty practices tend to be larger. Studies have found that many specialty practices have become larger in recent years to gain negotiating clout, among other reasons.14 Many of these practices are large enough that insurers would be unable to offer adequate local access to the specialty without them, giving them substantial leverage with insurers.
Hospitals are in an even stronger negotiating position than specialist physicians. Hospitals typically are large entities that provide a high volume of patient care, giving a hospital or hospital system leverage that physician practices rarely, if ever, have. At the top of the negotiating heap are the must-have hospitals that offer some unique combination of reputation, location and services. Private insurers understand that employers will not continue to offer their products if must-have hospitals are excluded from the provider network. Even in metropolitan areas with many competing hospitals and hospital systems, these must-have hospitals can command unusually high prices. Also, hospitals increasingly have merged into systems, which may allow affiliated hospitals in a market to negotiate collectively with insurers. And, many hospitals are employing physicians and purchasing physician practices and then including physicians in their negotiations with insurers, which may result in more leverage for both the hospitals and the physicians.
Back to Top
Unused Insurer Leverage?
![]() rovider leverage is only one side of the market, and market concentration on the insurer side also appears to play a role in the level and degree of price variation.15 Insurers’ leverage is based on their share of the insurance market and their willingness and ability to steer patient volume to providers included in their provider networks. Blue Cross Blue Shield of Michigan (BCBSM) is a particularly dominant insurer in all of the Michigan markets, while some other markets, such as Cleveland, lack such a dominant insurer.
rovider leverage is only one side of the market, and market concentration on the insurer side also appears to play a role in the level and degree of price variation.15 Insurers’ leverage is based on their share of the insurance market and their willingness and ability to steer patient volume to providers included in their provider networks. Blue Cross Blue Shield of Michigan (BCBSM) is a particularly dominant insurer in all of the Michigan markets, while some other markets, such as Cleveland, lack such a dominant insurer.
For an employer seeking affordable health coverage, competition among health plans is a double-edged sword. When multiple health plans compete for an employer’s business, they face pressure to keep their administrative costs and profits low, which will tend to reduce premiums.16 But, when the health insurance market is fragmented, plans have less leverage when negotiating prices with medical providers, which tends to increase provider prices and, therefore, premiums.17
Blue Cross Blue Shields plans, which are the primary insurance carriers for the autoworker health plans, vary from state to state in their market share. BCBSM is unusual in the degree to which it dominates Michigan’s commercial market.18 In an analysis of competition among commercial health plans, the American Medical Association ranked Michigan as the third least-competitive state.19
Five of the 13 markets analyzed are in Michigan, and the other eight—with one exception—are in other Midwestern states without such concentrated insurance markets. Contrasting Michigan markets with those in other states allows some limited observations on how a dominant insurer affects price levels and price variation.
Within the Michigan markets, prices vary less from hospital to hospital and from physician practice to practice than in markets outside of Michigan. This finding is consistent with the idea that BCBSM is less vulnerable than other insurers to price demands from must-have providers. And, hospital prices tend to be lower on average in Michigan markets than in the markets outside Michigan, particularly for outpatient services. But BCBSM does not appear to have used its market power to force physician prices down to levels seen in other markets. For example, the prices paid to primary care physicians in Michigan tend to be higher than in markets outside Michigan. This may reflect an active effort by BCBSM to incentivize primary care and other physician practices to increase their capabilities to provide more patient-centered and effective care to treat complex patients, presumably with the expectation that this will reduce hospital and other costs in the long run. It may also be the case that BCBSM sees little gain and some political and legal risk in alienating providers by using its dominant position to reduce prices. As previous research indicates, dominant insurers do not need to push prices down aggressively, they just need “to do better than the competition.”20
Back to Top
Potential Savings
![]() iven the growing evidence of significant intramarket price variation, especially for hospitals, purchasing strategies designed to guide patients to high-value providers clearly offer potential savings. Approaches such as reference pricing, where the payer sets a maximum allowed amount for a specific procedure in a specific market, have produced savings and put downward pressure on prices of outlier providers in some markets.21 Other innovations in benefit design, when accompanied by information to enrollees about differences in what they will have to pay when using different providers, clearly have roles to play in such approaches.
iven the growing evidence of significant intramarket price variation, especially for hospitals, purchasing strategies designed to guide patients to high-value providers clearly offer potential savings. Approaches such as reference pricing, where the payer sets a maximum allowed amount for a specific procedure in a specific market, have produced savings and put downward pressure on prices of outlier providers in some markets.21 Other innovations in benefit design, when accompanied by information to enrollees about differences in what they will have to pay when using different providers, clearly have roles to play in such approaches.
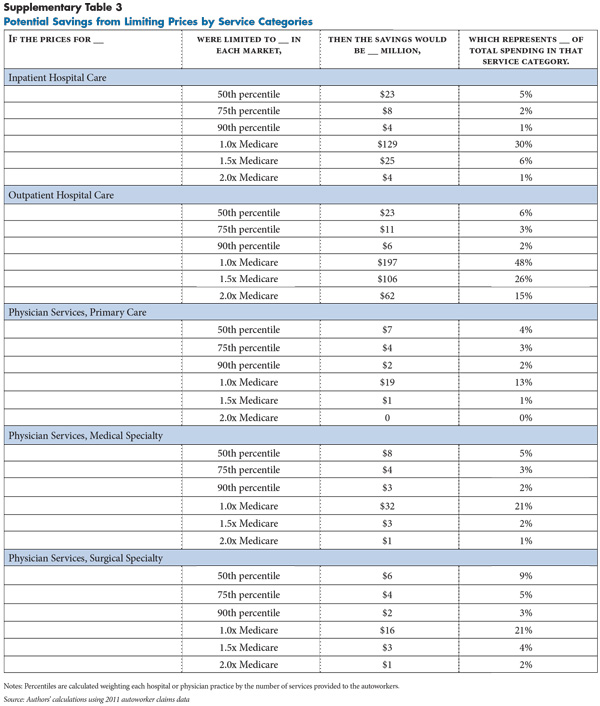
To get a very rough sense of the magnitude of potential savings from such purchasing strategies, actual plan spending was compared with hypothetical spending with a price ceiling equal to the 50th percentile of the current price distribution in each market. The 50th percentile price, or median, for a given market represents the price at which half of the services in that market were provided by higher-priced providers and half were provided by lower-priced providers. The second set of hypothetical price ceilings are multiples of Medicare prices: 1.0 and 1.5.
The potential savings from capping prices at the 50th percentile scenarios only represent 5.5 percent of physician and hospital spending in the plans. To put the savings in perspective, the average annual growth in per capita spending for employer-sponsored health insurance has been between 7 percent and 8 percent per year.22 So, the savings from rolling out an aggressive program of active purchasing might only slow trend by less than a year. However, even small percentage gains can make a significant difference given the enormous amount many large employers spend on health care. Additionally, active purchasing may begin to give large purchasers a more direct role in health care payment and delivery decisions. Active purchasing strategies will face challenges, including resistance to change from providers, insurers and enrollees.
More significant savings are possible if prices are limited to a level below what is now considered normal. By far the biggest opportunity for savings appears in the hospital outpatient setting, where setting a ceiling on prices equal to Medicare would reduce spending by 48 percent and a ceiling equal to 1.5 times Medicare would reduce spending by 26 percent (see Supplementary Table 3). But, such a dramatic change might require governmental rate setting and force hospitals and specialist physician practices to cope with significantly constrained revenue.
Back to Top
Looking Ahead
![]() ven though overall U.S. health spending has grown more slowly in recent years, premiums for employer-sponsored health insurance have continued to rise at an unsustainable rate. And, increases in provider prices explain most if not all of the increase in premiums.23 If this trend continues, employers will face increasing pressure to restrain spending growth, either reducing benefits, shifting costs to employees, or using some form of active purchasing to mitigate price increases. Insurers are consolidating and becoming more adept and experienced in implementing active purchasing. But, at the same time, consolidation continues apace on the provider side, recently including the employment of many physicians by hospitals. As a result, health plans may face only stiffening resistance to attempts to rein in high prices.
ven though overall U.S. health spending has grown more slowly in recent years, premiums for employer-sponsored health insurance have continued to rise at an unsustainable rate. And, increases in provider prices explain most if not all of the increase in premiums.23 If this trend continues, employers will face increasing pressure to restrain spending growth, either reducing benefits, shifting costs to employees, or using some form of active purchasing to mitigate price increases. Insurers are consolidating and becoming more adept and experienced in implementing active purchasing. But, at the same time, consolidation continues apace on the provider side, recently including the employment of many physicians by hospitals. As a result, health plans may face only stiffening resistance to attempts to rein in high prices.
Back to Top
Notes
| 1. | Reinhardt, Uwe E., “The Pricing of U.S. Hospital Services: Chaos Behind a Veil of Secrecy,” Health Affairs, Vol. 25, No. 1 (January 2006). |
| 2. | King, Jaime S., Morgan Muir, and Stephanie Alessi, Price Transparency in the Healthcare Market, UCSF/UC Hastings Consortium on Law, Science and Health Policy (March 18, 2003). |
| 3. | Anderson, Gerard F., et al., “It’s the Prices, Stupid: Why the United States is so Different from Other Countries,” Health Affairs, Vol. 22, No. 3 (May 2003). |
| 4. | Zuckerman, Stephen, and Dana Goin, How Much Will Medicaid Physician Fees for Primary Care Rise in 2013? Evidence from a 2012 Survey of Medicaid Physician Fees, Kaiser Commission on Medicaid and the Uninsured, Washington, D.C. (December 2012). |
| 5. | Dobson, Allen, Joan DaVanzo and Namrata Sen, “The Cost-Shift Payment ‘Hydraulic’: Foundation, History, and Implications,” Health Affairs, Vol. 25, No. 1 (January 2006). |
| 6. | Berenson, Robert A., et al., “The Growing Power of Some Providers to Win Steep Payment Increases from Insurers Suggests Policy Remedies May Be Needed,” Health Affairs, Vol. 31, No. 5 (May 2012). |
| 7. | Ginsburg, Paul. B., Wide Variation in Hospital and Physician Payment Rates Evidence of Provider Market Power, Research Brief No. 16, Center for Studying Health System Change, Washington, D.C. (November 2010). |
| 8. | Centers for Medicare & Medicaid Services, Medicare Provider Charge Data: Inpatient Charge Data, FY 2011, and Medicare Provider Charge Data: Outpatient Charge Data, CY 2011, Washington, D.C. (2013). |
| 9. | The major excluded category is prescription drugs, but, based on a previous analysis, prices for prescription drugs are more or less uniform in the autoworker plans. All enrollees in the autoworker plans, regardless of where they live or which medical plan they enroll in, are enrolled in the same prescription drug plan. As a result, the prices paid for prescription drugs in the autoworker plans do not vary within or among markets. |
| 10. | Prices are measured at the level of the physician practice rather than the individual physician, because it is the physician practice that negotiates prices with insurers. Physician practices are identified by tax identification numbers. A practice could consist of a single physician or a multiple-physician group. |
| 11. | The rationale for measuring prices relative to Medicare is fourfold: 1) Medicare is, by far, the largest single payer of U.S. health care services, which makes it a natural benchmark; 2) Medicare prices are not negotiated and are, therefore, not affected by negotiating leverage in the same way as private prices, 3) the ostensible goal of Medicare’s price setting is to cover the costs of efficient providers not to set prices as low as possible or to overpay; and 4) Medicare prices are adjusted for the complexity of the services provided, local variation in wages, and for the fact that some providers (e.g. teaching hospitals) incur higher costs as part of pursuing a broader social mission. Medicare prices are by no means perfect, but they offer a meaningful benchmark. For a discussion of Medicare’s price-setting approach see Hayes, Katherine J., Julian Pettengill and Jeffrey Stensland, “Getting the Price Right: Medicare Payment Rates for Cardiovascular Services,” Health Affairs, Vol. 26, No. 1 (January 2007). |
| 12. | Medicare Payment Advisory Commission, Aligning Incentives in Medicare, Washington, D.C. (June 2010). |
| 13. | Kleiner, Samuel A., Sean Lyons and William D. White, “Provider Concentration in Markets for Physician Services for Patients with Traditional Medicare,” Health Management, Policy and Innovation, Vol. 1, No. 1 (Sept. 14, 2012). |
| 14. | Berenson, et al. (2012). |
| 15. | Melnick, Glen, Yu-Chu Shen and Vivian Yaling Wu, “The Increased Concentration of Health Plan Markets Can Benefit Consumers through Lower Hospital Prices,” Health Affairs, Vol. 30, No. 9 (September 2011). |
| 16. | Dafny, Leemore, “Are Health Insurance Markets Competitive?” American Economic Review, Vol. 100, No. 4 (September 2012). |
| 17. | Melnick, Shenand and Wu (2011). |
| 18. | Christianson, Jon B., et al., Detroit: Motor City to Medical Mecca?, Community Report, National Institute for Health Care Reform, Washington, D.C. (August 2010). |
| 19. | American Medical Association, Top 10 States with the Least Competitive Commercial Health Insurance Markets, Washington, D.C. (2012). |
| 20. | Berenson, et al. (2012). |
| 21. | Robinson, James C., and Timothy T. Brown, “Increases in Consumer Cost Sharing Redirect Patient Volumes and Reduce Hospital Prices for Orthopedic Surgery,” Health Affairs, Vol. 32, No. 8 (August 2013). |
| 22. | Milliman, 2012 Milliman Medical Index, Seattle, Wash. (May 2012). |
| 23. | Health Care Cost Institute, Health Care Cost and Utilization Report: 2011, Washington, D.C. (September 2012). |
Back to Top
Data Source
This Research Brief uses detailed facility and professional 2011 claims data for current and retired autoworkers and their dependents under age 65. General Motors, Chrysler and Ford and the UAW Retiree Medical Benefits Trust provided claims for enrollees living in one of 25 selected metropolitan markets and the nonmetropolitan areas of Michigan. The claims data include detailed information on the service provided, the allowed amount—the total amount paid to the provider, including amounts paid by the insurer and the enrollee—and provider identifying information (name, zip code, tax identification number and national provider identifier). Markets were included in this Research Brief if they met the following three criteria: 1) at least 10,000 enrollees lived in the market; 2) two or more hospitals each provided 50 or more inpatient hospital admissions to the autoworkers; and 3) two or more hospitals each provided 100 or more outpatient hospital services to the autoworkers. Thirteen markets met these criteria: Ann Arbor, Mich.; Buffalo, N.Y.; Cleveland; Detroit; Flint, Mich. Indianapolis; Kansas City; Kokomo, Ind.; Lansing, Mich.; St. Louis; Toledo, Ohio; Warren, Mich.; and Youngstown, Ohio.
Supplementary Tables
Technical Appendix
Aggregating Claims. Insurers pay providers using a variety of methods that vary in their level of aggregation or bundling, and raw claims data reflect that variation. For example, some inpatient hospital stays appear as a single claim for the entire stay, while others appear as multiple claims for different services (e.g. room and board, operating room time), and others appear as separate bills for each day of the stay. Claims are also sometimes denied, adjudicated and adjusted, and providers often resubmit claims, which can result in a single service generating multiple claims, some with negative allowed amounts. Therefore, claims are aggregated to the service level so that one observation in the cleaned data set represents one service.
Inpatient claims are aggregated to the diagnosis-related group (DRG) level so that amounts paid to the facility for all services associated with one hospital stay are included (amounts paid to physicians or other non-hospital providers are excluded). Claims containing the same DRG code, patient identifier, provider identifier and date of service (or consecutive dates of service) were summed.
For hospital outpatient and physician services, line items were aggregated to the Healthcare Common Procedure Coding System (HCPCS) code level, based on patient identifier, provider identifier and date of service. Claims at times appear more than once in the raw data set because of claim reconciliation and, where possible those claims were canceled out.
Simulating Medicare Prices. For each hospital and physician service, a simulated price was assigned equal to the amount that would have been paid in the Medicare fee-for-service program. Simulated Medicare prices include adjustments for local input prices, provider-specific adjustments (e.g. higher payments to teaching hospitals), and adjustments for the type of service provided. All claims for which a Medicare price could not be simulated were dropped (e.g. because of missing procedure codes), or for which the price was outside the range of 20 percent to 1000 percent of Medicare. A large number of hospital outpatient claims were also dropped because a Medicare price could not be simulated. Those outpatient claims were dropped because they included one or more line items with a missing HCPCS code and a positive allowed amount, or a HCPCS code with a special payment provision (e.g. pass-through payments for drugs and biologicals), or a HCPCS code that is not paid using a fee schedule and not through Medicare’s hospital outpatient prospective payment system (e.g. rehabilitation therapy).
Measuring provider- and market-level prices. The claims-level data were then summarized to create two price indexes for each hospital (an inpatient price index and an outpatient price index), and up to three price indexes for each physician practice (primary care, medical specialty and surgical specialty). Hospital claims were assigned identifiers from the American Hospital Association survey based on information in the claims data (national provider identifiers, provider name and provider zip code). Physician practices were identified based on tax identification numbers reported on claims. The provider-level price indexes summarize the amount paid in the autoworker plans relative to the total amount that would have been paid to that provider by the Medicare fee-for-service program for the same services.
Providers were assigned to markets based on their location. For example, the Flint, Mich., market includes all hospitals physically located in the counties that make up that metropolitan statistical area. For each market, various percentiles were measured (10th, 25th, 50th 75th and 90th) in the distribution of the provider-level price indexes. These distributions were weighted by the number of autoworker claims. The degree of price variation was summarized within a market using the ratios of the weighted percentiles. Inpatient and outpatient prices were measured for each hospital, and those prices are displayed in Figures 1 and 2 for all hospitals that provided significant volume to the autoworkers (50 or more inpatient stays and 100 or more outpatient claims).
Funding Acknowledgement
This Research Brief was funded by the National Institute for Health Care Reform. The Institute is a 501(c)(3) nonprofit, nonpartisan organization established by the International Union, UAW; Chrysler Group LLC; Ford Motor Company; and General Motors. The Institute contracts with the Center for Studying Health System Change (HSC) to conduct health policy research and analyses to improve the organization, financing and delivery of health care in the United States.