
Community Report No. 8
July 2011
Aaron Katz, Robert A. Berenson, Gary Claxton, Marisa K. Dowling, Caroleen W. Quach, Divya R. Samuel
In July 2010, a team of researchers from the Center for Studying Health System Change (HSC), as part of the Community Tracking Study (CTS), visited the Phoenix metropolitan area to study how health care is organized, financed and delivered in that community. Researchers interviewed more than 45 health care leaders, including representatives of major hospital systems, physician groups, insurers, employers, benefits consultants, community health centers, state and local health agencies, and others. The Phoenix metropolitan area encompasses Maricopa and Pinal counties.
After more than a decade of rapid population growth and a thriving economy, Phoenix’s once-booming health care market has adopted a more cautious outlook amid the lingering effects of the great recession. Job losses and the subsequent loss of employer-sponsored health insurance, along with a high rate of home foreclosures, have adversely affected many Phoenix residents. At the same time, employers, especially small firms, and health plans continued to search for ways to reduce health insurance premiums. In response, hospitals and physicians increasingly were rethinking expansion plans and seeking closer collaborations.
Against this backdrop of new-found provider caution, significant state-level attention to illegal immigration and a state budget crisis have sparked changes across the area’s health care system. State laws enacted over the past few years reportedly have led many immigrant families to either leave Arizona or go underground, avoiding interaction with public agencies and health care providers and programs. At the same time, the state is struggling to close the wide gap between declining tax revenue and rising public program costs, leading to reductions of public health coverage that could drive the area’s already high rate of uninsurance even higher.
Key developments include:
- Recession Hits Late but Hard
- More State Budget Woes on the Horizon
- Phoenix Safety Net Providers Hang On
- Hospital Financially Healthy, but Concerns Grow
- Physician Independence Remains Strong
- Physicians and Hospitals Align
- Health Plan Price Competition, but Little Innovation
- Anticipating Health Care Reform...or Not
- Issues to Track
- Background Data and Funding Acknowledgement
Recession Hits Late but Hard
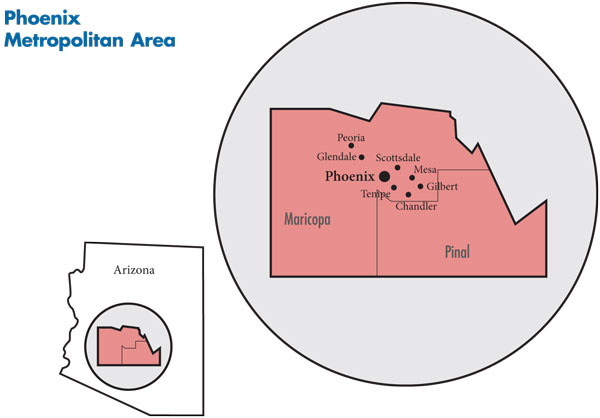
![]() he Phoenix metropolitan area is a sprawling region of more than 14,000 square miles—almost twice the size of Massachusetts—but the bulk of the population and health care providers are concentrated in the valley that, along with Phoenix, includes the communities of Mesa, Scottsdale, Glendale, Tempe, Chandler, Gilbert and Peoria (see map on page 2). With 4.4 million residents—nearly a third Latino—the Phoenix metropolitan area has as many people as the entire state of Colorado and has grown significantly faster than other large metropolitan areas on average—17.2 percent vs. 5.5 percent between 2004 and 2009. However, this growth has slowed as many immigrant families—once a primary source of population growth—face an anti-immigrant climate and loss of job prospects. Many have reportedly left the state.
he Phoenix metropolitan area is a sprawling region of more than 14,000 square miles—almost twice the size of Massachusetts—but the bulk of the population and health care providers are concentrated in the valley that, along with Phoenix, includes the communities of Mesa, Scottsdale, Glendale, Tempe, Chandler, Gilbert and Peoria (see map on page 2). With 4.4 million residents—nearly a third Latino—the Phoenix metropolitan area has as many people as the entire state of Colorado and has grown significantly faster than other large metropolitan areas on average—17.2 percent vs. 5.5 percent between 2004 and 2009. However, this growth has slowed as many immigrant families—once a primary source of population growth—face an anti-immigrant climate and loss of job prospects. Many have reportedly left the state.
The effects of the recession were late to hit Phoenix, with unemployment only recently rising from lower-than-average to near the national average as employers have continued to shed jobs, particularly in construction. The jump in unemployment rates has likely led to loss of employer-sponsored health insurance in this community with an already high rate of uninsured people—almost one in five residents. The Phoenix area has a higher-than-average proportion of low-income residents, and high rates of home foreclosures have worsened the plight of thousands of residents.
The hospital sector in Phoenix is fairly diverse, with multiple hospital systems, although Banner Health, with nearly 2,800 beds in 12 hospitals in the metro area and market share of more than 40 percent, is by far the largest. Despite the economic downturn, most Phoenix hospitals have done well financially, primarily from continuing to gain significant payment rate increases from private insurers. At the same time, many hospitals’ uncompensated care burden stabilized or even declined as undocumented immigrants left the area.
Although Phoenix has a handful of larger multispecialty physician practices, Phoenix’s physician culture has emphasized independence and autonomy, resulting in most physicians practicing solo or in small, single-specialty groups. With private insurers’ rates at about Medicare levels, which have increased little since 2002, physicians were looking for alternatives. Long resisted in Phoenix, specialists were merging into larger practices to gain negotiating clout with payers and the scale to provide profitable ancillary services, such as laboratory testing and imaging. While less pronounced than in some markets, physicians also were interested in hospital employment.
The Phoenix market has no dominant health plan, with some observers describing a high level of competition among the four largest insurers: Blue Cross Blue Shield of Arizona, UnitedHealth Group, CIGNA and Aetna.
The area’s safety net is anchored by the public Maricopa Integrated Health System (MIHS), which includes a hospital and community clinics. Additionally, a number of federally qualified health centers (FQHCs) and free clinics also serve low-income people.
More State Budget Woes on the Horizon
![]() rizona’s fiscal fortunes have changed dramatically since the mid-2000s, when rapidly growing tax revenues from economic expansion created a state budget surplus. Precipitously falling tax revenues resulting from the economic downturn led to significant state budget cuts to safety net programs, despite voters approving a one-cent increase in the state sales tax effective June 1, 2010. While increased federal Medicaid matching funds, which ended in July 2011, helped shore up the state Medicaid program, state officials have sought federal relief from Medicaid maintenance-of-effort requirements to curtail eligibility for childless adults.
rizona’s fiscal fortunes have changed dramatically since the mid-2000s, when rapidly growing tax revenues from economic expansion created a state budget surplus. Precipitously falling tax revenues resulting from the economic downturn led to significant state budget cuts to safety net programs, despite voters approving a one-cent increase in the state sales tax effective June 1, 2010. While increased federal Medicaid matching funds, which ended in July 2011, helped shore up the state Medicaid program, state officials have sought federal relief from Medicaid maintenance-of-effort requirements to curtail eligibility for childless adults.
Arizona gained national attention by eliminating KidsCare, its Children’s Health Insurance Program, during the 2010-11 legislative session. Because termination of KidsCare would have violated one of the maintenance-of-effort provisions under the federal health reform law, resulting in a loss of roughly $7.8 billion in federal funding, the Legislature restored the program.
Enrollment in KidsCare, however, has been frozen since January 2010. The “cap and freeze” means that if a child moves off KidsCare, another cannot be added, so the enrollment trend is down—parents “forget to renew and [their children] get frozen out,” one market observer said. In addition, premiums for KidsCare families with incomes of 150 percent to 200 percent of the federal poverty level—or $33,075 to $44,100 for a family of four in 2010—doubled from $35 per month to $70 for fiscal year 2010. These changes, along with immigrant families leaving the state, reportedly contributed to statewide enrollment in KidsCare dropping from a peak of about 66,000 children in May 2008 to about 20,000 by April 2011, according to state data.
Also during the 2010-11 legislative session, Arizona lawmakers voted to remove many childless adults from the state’s Medicaid program, called the Arizona Health Care Cost Containment System (AHCCCS). The decision to reduce income eligibility from 100 percent of poverty to 33 percent for childless adults reversed a Medicaid expansion enacted by voters in 2000 using tobacco tax revenues. But, costs had outstripped revenue, so the expansion had been subsidized by state general revenues. Because curtailing coverage for childless adults would have violated federal restrictions on cutting eligibility levels, Gov. Jan Brewer in early 2011 requested a federal waiver to exempt the state from maintenance–of-effort requirements and allow the state to eliminate coverage for many childless adults, citing significant budget deficits. Arizona received federal approval to freeze enrollment for many childless adults in early July 2011, which the state estimates will reduce enrollment by approximately 100,000 people over the first year.
Effective Oct. 1, 2010, other Medicaid cuts included: elimination of various optional Medicaid benefits, notably adult dental and preventive services, organ transplant surgeries, and podiatric care—the latter raising particular concern for diabetic patients. The transplant cut—including certain types of pancreas, liver, heart, lung and bone-marrow transplants—brought Arizona unwanted national attention in late 2010 and early 2011 when several Arizona Medicaid patients waiting for transplants died. In April 2011, Brewer signed a state budget that restored Medicaid funding for most transplants.
Faced with a $1.5 billion shortfall for fiscal year 2012, the state has continued to cut spending dramatically, including Medicaid reimbursement rates for hospitals and physicians. Some observers expected the rate cuts to result in more private physicians—both primary care and specialists—reducing or ending their participation in Medicaid.
Phoenix Safety Net Providers Hang On
![]() tate budget cuts and lingering fallout from the recession have intensified pressures on Phoenix safety net providers amid increasing demand from more unemployed and uninsured people. Some providers have been able to meet these challenges through increased federal funds, revised payment collection policies and greater efficiencies in service delivery.
tate budget cuts and lingering fallout from the recession have intensified pressures on Phoenix safety net providers amid increasing demand from more unemployed and uninsured people. Some providers have been able to meet these challenges through increased federal funds, revised payment collection policies and greater efficiencies in service delivery.
At the same time, volume increases may have been muted by the departure of immigrants in response to the weak economy and the inhospitable legal environment. In fact, some safety net providers reported more favorable payer mixes because of fewer uninsured immigrants. Fear and uncertainty reportedly have caused some immigrants to avoid seeking care even at public entities, such as the local health department or MIHS. Respondents cited the recent exodus of undocumented families as among the reasons for a general drop in demand for maternity services and trauma care across the region.
The governance of MIHS was transferred from the Maricopa County Board of Supervisors to the Maricopa County Special Health Care District in 2005, ending the county’s direct financial responsibility for MIHS operations. The Special Health Care District has a five-member Board of Directors—elected by county voters—and is authorized to levy property taxes to help support MIHS. The system’s central downtown campus includes a teaching hospital known for critical care services, especially adult and pediatric Level 1 trauma and intensive care, as well as the country’s second largest burn treatment center. The system also operates 11 family health centers with FQHC look-alike status, which provides enhanced Medicaid reimbursement but not access to federal grants. After almost losing Joint Commission accreditation in 2007, MIHS obtained full accreditation in December 2008 and has since worked to improve patient satisfaction. The hospital moved from four-bed wards to two-bed rooms, decreasing its 449 beds by almost half; upgraded existing infrastructure, such as remodeling the pediatric emergency department; and developed and expanded medical services at the family health centers.
MIHS has recovered from previous financial crises, but the system was still working to strengthen its bottom line and payer mix. The property tax revenues that MIHS receives through the Special Health Care District have increased gradually over the past few years to approximately $56 million in fiscal year 2011. The system’s uncompensated care costs reportedly have been stable, and Medicaid revenue has increased in the system’s clinics. The system has formalized its sliding-fee-scale requirements and collection policies for uninsured people seeking care, who, in some cases, must pay up-front deposits before services are provided. On the other hand, the system’s net income may have suffered recently because of reduced state payments for uncompensated care and graduate medical education.
The longstanding FQHCs in Phoenix are Adelante Healthcare and Mountain Park Health Center. The centers’ financial status reportedly has improved despite elimination of the tobacco tax-funded Arizona Primary Care Program, which supported care for low-income, uninsured patients. Respondents suggested that substantial growth in demand from Medicaid patients who generate enhanced reimbursement for FQHCs, as well as federal grants, provided some relief for the health centers. Mountain Park’s patient base had doubled in the last three years to about 25,000 in 2010, and it has maintained financial stability in part by attracting more Medicaid and privately insured patients, along with nearly $6 million in federal grants. Adelante, which has a much more diversified patient base today than when it began as a free clinic for migrant farm workers, shored up its bottom line through stricter collection of patient fees.
The number of federally qualified health centers in Phoenix has increased in recent years. Wesley Community Center and Native American Community Health Center attained FQHC status through the award of New Access Point grants under the 2009 American Recovery and Reinvestment Act. Wesley and Native Health used federal dollars to hire additional clinicians and upgrade physical plants and information technology capacity. Free clinics, including the Society of St. Vincent de Paul/Virginia G. Piper Medical and Dental Clinic, Neighborhood Christian Clinic and Mission of Mercy, also serve low-income and uninsured people in the Phoenix area but are not eligible for federal grants.
Hospitals Financially Healthy, but Concerns Grow
![]() n recent years, most major Phoenix hospitals have performed well financially. According to market observers, many hospitals have achieved annual high single-digit and, for some, double-digit payment rate increases from private insurers. Meanwhile, many hospitals’ uncompensated care burden has stabilized or even decreased slightly because they are seeing fewer undocumented immigrants. Although hospital payment rates under AHCCCS had been spared previous cuts—Medicaid rates were relatively high compared to other states—a 5-percent cut in hospital payment rates took effect in April 2011. Maternity and emergency department visits had dropped significantly, in part because of the exodus of immigrant families, and some hospitals had lost some elective surgeries, but service volume overall reportedly had held up.
n recent years, most major Phoenix hospitals have performed well financially. According to market observers, many hospitals have achieved annual high single-digit and, for some, double-digit payment rate increases from private insurers. Meanwhile, many hospitals’ uncompensated care burden has stabilized or even decreased slightly because they are seeing fewer undocumented immigrants. Although hospital payment rates under AHCCCS had been spared previous cuts—Medicaid rates were relatively high compared to other states—a 5-percent cut in hospital payment rates took effect in April 2011. Maternity and emergency department visits had dropped significantly, in part because of the exodus of immigrant families, and some hospitals had lost some elective surgeries, but service volume overall reportedly had held up.
The biggest player in Phoenix’s hospital market, Banner Health, expanded into the West Valley in 2007 with the acquisition of Arizona Medical Clinic, a multispecialty physician group, followed in 2008 by the purchase of Sun Health’s two hospitals and Medicare Advantage plan, MediSun. These purchases established Banner as a valley-wide provider. In the East Valley, Banner opened Cardon Children’s Medical Center in Mesa in 2009 and has negotiated an affiliation with MD Anderson Cancer Center of Houston with plans to open an outpatient cancer center in Gilbert in late 2011.
Although Banner is the largest system by far—“everyone has to be aware of where Banner is,” one respondent said—the rest of the hospital market is split among a variety of medium-sized and small organizations. Multi-state Catholic Healthcare West is the next largest system with four hospitals in the Phoenix area, including flagship St. Joseph’s Hospital and Medical Center, totaling almost 900 beds and comprising nearly 15 percent of the market. St. Joseph’s recently affiliated with Phoenix Children’s Hospital to consolidate pediatric services at the children’s hospital. Other hospital systems in the Phoenix area include Abrazo Health Care with six hospitals, including a specialty heart hospital; John C. Lincoln Health Network with two hospitals; IASIS Healthcare with three hospitals; and Scottsdale Healthcare with three hospitals. Already established physician-owned hospitals continued to have a modest presence in the market, but the future role of such entities appeared less certain given limitations on their growth enacted by the federal health reform law.
The hospital market was described as fairly competitive, but observers noted that some hospitals have been able to maintain unique niches and were considered “must-have” hospitals in health plan networks along with Banner. Scottsdale Health, for example, faces little competition in that affluent community, and St. Joseph’s has established itself as a critical provider of some specialty-service lines, especially neurology and neurosurgery. One insider described the hospital landscape as “more a mixture of competition and collaboration as opposed to pure competition.”
Hospitals expanded as the area’s population grew rapidly, which more recently has raised concerns about the addition of too much capacity now that population growth has slowed. However, the Phoenix area’s supply of hospital beds remained lower than average as of 2008—2 beds per 1,000 people vs. 2.5 beds in large metropolitan areas. With a higher percentage of children compared to other metropolitan areas, one of the market’s major expansions has been in pediatrics, with the opening of Banner’s Cardon Children’s Medical Center in late 2009 and Phoenix Children’s 11-story patient tower in January 2011. But the agreement between St. Joseph’s and Phoenix Children’s Hospital to consolidate many pediatric services suggests the expansions may have outpaced demand.
Other new facilities since 2008 include Banner Ironwood Hospital; Western Regional Center, which is owned by Cancer Treatment Centers of America; Scottsdale’s Thompson Peaks Hospital; and the full-service Gilbert Hospital, which is physician owned. Abrazo and Arrowhead hospital systems also opened freestanding emergency departments with attached physician offices in the high-growth areas of Peoria and Buckeye. As a result of these expansions, some observers suggested the long under-bedded Phoenix market might be slightly over-bedded.
In that vein, hospitals were proceeding with much more caution when considering expansions, given the poor economy and uncertainty about implementation of national health reform. Some projects were delayed and some services closed. For example, John C. Lincoln Health Network closed an unprofitable birthing center and converted the space to surgical suites, and Phoenix Children’s Avondale hospital has been delayed two years. Falling patient volume for some services and hospital expectations that negotiations with health plans over payment rates will get tougher were among reasons cited for the more cautious approach.
Hospital respondents also were concerned that one result of health reform’s coverage expansions starting in 2014 would be a shift of many patients from relatively high-paying commercial insurers into either the AHCCCS program or plans offered through a health insurance exchange, which hospitals assumed would reimburse at lower levels than existing commercial plans. Employers also may raise pressures on providers as they shop for lower premiums and shift more costs to workers. As a hospital respondent summarized, because of the economy, the state deficit and Medicare reimbursement declines, “The only response is to be more efficient on the cost side.”
Phoenix hospitals appeared less focused than hospitals in other markets on developing accountable care organizations envisioned under health reform to promote quality improvement and efficiency. Instead, hospitals were more focused on how to cut their cost structures, with some reports of discussions between payers and hospitals about “how to do more with less and still improve outcomes.” Examples of cost-cutting strategies included reducing overtime, altering workforce policies for accruing and taking leave, restricting travel, increasing productivity, delaying capital projects, and expanding use of generic drugs. In the case of Banner, such efforts had already resulted in reported savings of tens of millions of dollars. A major factor helping hospital efforts to reduce operating expenses was the return of many nurses to the workforce as a result of the recession, with a consequent reduction in pressure for wage increases and less need to use temporary contract nurses to fill shifts.
Physician Independence Remains Strong
![]() lthough most Phoenix physicians remained in solo or small group practices, changes were emerging to this long-standing pattern. In addition to rising costs and flat reimbursements, medical practices were feeling the pressure to install expensive electronic health records and having difficultly recruiting physicians to replace retiring partners given the relatively low income potential in the market. Younger physicians, especially in primary care specialties, were increasingly interested in employment arrangements offering greater job security and more predictable schedules.
lthough most Phoenix physicians remained in solo or small group practices, changes were emerging to this long-standing pattern. In addition to rising costs and flat reimbursements, medical practices were feeling the pressure to install expensive electronic health records and having difficultly recruiting physicians to replace retiring partners given the relatively low income potential in the market. Younger physicians, especially in primary care specialties, were increasingly interested in employment arrangements offering greater job security and more predictable schedules.
Coinciding with the pressures on physicians, hospitals were, likewise, seeing benefits to closer relationships with medical staff to solidify referrals and work on quality improvement projects. Prominent employed groups include St. Joseph’s Hospital’s group of 200 mostly specialists, which had grown by 40 in the last two years, and Banner Medical Group, a three-year old system-wide group that employs about 400 physicians, primarily specialists. In particular, hospitals moved to employ more trauma care and related specialists, because they viewed employment as more efficient than paying stipends as high as $2,500 a night for on-call coverage. Similarly, observers also cited high costs for the growing trend among hospitals to employ hospitalists rather than contracting with hospitalist groups for coverage. Hospitals in general expected that new organizational and payment approaches emerging from health reform will encourage greater alignment between physicians and hospitals.
Recognizing that most established physicians remained committed to independent practice, Phoenix hospitals were seeking closer alignment with physicians through means other than employment, including such contracting mechanisms as physician hospital organizations and medical service organizations. Such organizational structures could allow hospitals to better respond to new payment initiatives, such as bundled payments and incentives for reducing preventable readmission rates. One prominent example was Banner Physician Hospital Organization, a 700-plus group of employed and community physicians formed to facilitate risk-based contracting with commercial payers. Some observers suggested hospitals can negotiate higher payment rates for physicians in these arrangements. Banner also operates a management services organization called PrimeCare Network that represents 625 physicians.
One respondent noted that the multiple approaches to handling physicians reflected that hospitals, on the whole, are “agnostic on whether a physician wants to be employed or just aligned.” Hospital representatives emphasized that they are trying to be non-threatening and opportunistic in aligning with or employing physicians.
Health Plan Price Competition, but Little Innovation
![]() bservers characterized the Phoenix health plan market as more competitive than many others nationally because of the lack of a dominant player. In addition to the top four health plans—Blue Cross Blue Shield of Arizona, UnitedHealth Group, CIGNA and Aetna—other competitors include Humana and Health Net, which are most active in the Medicare market.
bservers characterized the Phoenix health plan market as more competitive than many others nationally because of the lack of a dominant player. In addition to the top four health plans—Blue Cross Blue Shield of Arizona, UnitedHealth Group, CIGNA and Aetna—other competitors include Humana and Health Net, which are most active in the Medicare market.
Benefit levels historically have been relatively low in Phoenix, in part because of low rates of unionization. PPOs were the most commonly offered product, with HMOs playing more of a role in Medicaid and Medicare. Private coverage was falling because of job losses, and employers were shifting costs to employees by requiring a larger share of premium contributions, as well as higher patient cost sharing at the point of service through copayments and deductibles. Observers noted that as health insurance enrollment drops, health plans have become more competitive. Employers reportedly tend to move frequently among the top four plans, particularly small and mid-sized employers, to squeeze any savings they can by switching carriers.
The focus in the small-group market was low-premium products, which require high levels of patient cost sharing. Typical deductibles for employee-only coverage were reportedly in the $2,000 to $5,000 range with coinsurance of 30 percent. Workers in small firms often pay 50 percent of the premium for single coverage and 100 percent of the additional premium for family coverage. One consultant noted the growth of “value plans,” or limited-benefit plans, as an option for price-conscious, small employers.
Larger firms were also increasing patient cost sharing, with deductibles for employee-only coverage generally rising to $1,000 and coinsurance in the 10-percent to 20-percent range, with higher percentages for out-of-network services. Respondents reported growing interest in consumer-driven health plans (CDHPs)—high-deductible plans tied to a tax-advantaged savings account—by both small and large employers. Large firms tended to offer CDHPs as a choice rather than as full replacement.
As in other markets, self-insurance appeared to be growing in popularity, with firms with as few as 200 to 300 employees contemplating such a shift to reduce costs. Some observers suggested that even smaller groups were pursuing this strategy. One health plan reported self-funding employers with as few as 100 workers.
Interest in narrow-network products that limit choice of providers was growing, albeit slowly, as a way to address rising premiums, but they are difficult to organize in Phoenix because of hospitals that have unique geographic or service niches. One of the few narrow-network models was Humana’s high-performance network, which includes about 75 percent of its typical providers and was priced about 8 percent below products with the full network.
Most market observers noted little innovation in product design or provider payment methods. Respondents suggested the relative lack of innovation was a result of the lack of large employers headquartered in Phoenix that might drive local market developments and, more recently, employers and health plans waiting to see the implications of federal health reform.
Along with some price competition, health plans have focused on differentiating themselves through customer service and wellness programs. CIGNA, for example, sees a niche for products with incentives for members to pursue such activities as completing health risk assessments and biometric screenings and taking part in health coaching for targeted conditions. UnitedHealth Group emphasized its ability to use data to improve health care decisions, including integrating data from different sources—for example, claims, wellness, disease management and pharmacy—and sharing information in real-time with providers to improve decision making. United also provides information that allows consumers to see relative cost and quality measures by procedure at different facilities, although information was not available for all hospitals for all procedures. Blue Cross Blue Shield of Arizona introduced a hospital cost comparison tool that allows patients to see bundled cost estimates for approximately 40 procedures and compare inpatient and outpatient costs for select procedures. Some observers described much of the information provided by health plans as general in nature and not particularly useful to compare providers.
Anticipating Health Care Reform...or Not
![]() rizona state government opposes aspects of the federal Patient Protection and Affordable Care Act (PPACA), especially the legality of the individual mandate and coverage expansions. The state is a party to one of the lawsuits attempting to overturn the individual mandate, and voters approved a state constitutional amendment to prohibit implementation of the mandate.
rizona state government opposes aspects of the federal Patient Protection and Affordable Care Act (PPACA), especially the legality of the individual mandate and coverage expansions. The state is a party to one of the lawsuits attempting to overturn the individual mandate, and voters approved a state constitutional amendment to prohibit implementation of the mandate.
Despite this opposition, the state has moved ahead with implementation of parts of reform, albeit not as enthusiastically as some states. For example, the Governor’s Office of Economic Recovery reportedly was preparing to meet the health benefits exchange requirements, but legislation to do so has not yet been introduced.
In addition, some coordination was occurring at the community level. The Children’s Action Alliance, a research and advocacy organization, had convened a group of stakeholders to discuss how Arizona will implement reform. Funded by a local foundation, St. Luke’s Health Initiatives, the group was identifying issues such as which grants the state might be eligible for. St. Luke’s, itself, has been proactive in trying to help the state prepare for reform; for example, it funded a grant writer to work with the state Department of Insurance to respond to a federal funding opportunity to help states oversee insurance rate increases.
Despite the official position of the state, many respondents were positive about the potential effects of PPACA on expanding coverage, but they were also concerned that the state’s dark fiscal situation would undermine the potential gains. “The reality is that [the state] is where priorities will be set,” said one market observer, while another contended bluntly “[coverage expansion] is not going to happen unless the feds pay [the whole thing].” Indeed, not a few respondents expressed fear that Arizona*#151;the last state to participate in Medicaid in the early 1980s—might withdraw from the Medicaid program in the face of ongoing large budget gaps.
Issues to Track
Background Data
| Phoenix Demographics | ||
|---|---|---|
| Phoenix Metropolitan Area | Metropolitan Areas 400,000+ Population | |
| Population, 20091 | 4,364,094* | |
| Population Growth, 5-Year, 2004-20092 | 17.2%* | 5.5% |
| Age3 | ||
| Under 18 | 27.3%* | 24.8% |
| 18-64 | 61.2%# | 63.3% |
| 65+ | 11.5% | 11.9% |
| Education3 | ||
| High School or Higher | 83.7% | 85.4% |
| Bachelor’s Degree or Higher | 26.5% | 31.0% |
| Race/Ethnicity4 | ||
| White | 58.8% | 59.9% |
| Black | 4.2% | 13.3% |
| Latino | 30.9% | 18.6% |
| Asian | 2.7% | 5.7% |
| Other Races or Multiple Races | 3.4% | 4.2% |
| Other3 | ||
| Limited/No English | 12.6% | 10.8% |
# Indicates a 12-site low. |
||
| Economic Indicators | ||
|---|---|---|
| Phoenix Metropolitan Area |
Metropolitan Areas 400,000+ Population | |
| Individual Income less than 200% of Federal Poverty Level1 | 31.2% | 26.3% |
| Household Income more than $50,0001 | 55.5% | 56.1% |
| Recipients of Income Assistance and/or Food Stamps1 | 7.6% | 7.7% |
| Persons Without Health Insurance1 | 18.7% | 14.9% |
| Unemployment Rate, 20082 | 5.3% | 5.7% |
| Unemployment Rate, 20093 | 8.5% | 9.2% |
| Unemployment Rate, August 20104 | 9.1% | 10.0% |
Sources: |
||
| Health Status1 | ||
|---|---|---|
| Phoenix Metropolitan Area |
Metropolitan Areas 400,000+ Population | |
| Chronic Conditions | ||
| Asthma | 15.2% | 13.4% |
| Diabetes | 6.9% | 8.2% |
| Angina or Coronary Heart Disease |
4.3% | 4.1% |
| Other | ||
| Overweight or Obese | 60.1% | 60.2% |
| Adult Smoker | 15.2% | 18.3% |
| Self-Reported Health Status Fair or Poor |
15.6% | 14.1% |
|
||
| Health System Characteristics | ||
|---|---|---|
| Phoenix Metropolitan Area |
Metropolitan Areas 400,000+ Population | |
| Hospitals1 | ||
| Staffed Hospital Beds per 1,000 Population | 2.0 | 2.5 |
| Average Length of Hospital Stay (Days) | 4.5 | 5.3 |
| Health Professional Supply | ||
| Physicians per 100,000 Population2 | 178 | 233 |
| Primary Care Physicians per 100,000 Poplulation2 | 65# | 83 |
| Specialist Physicians per 100,000 Population2 | 113 | 150 |
| Dentists per 100,000 Population2 | 51 | 62 |
Average monthly per-capita reimbursement for beneficiaries enrolled in fee-for-service Medicare3 |
$791 | $713 |
# Indicates a 12-site low.. Sources:1 American Hospital Association, 2008 2 Area Resource File, 2008 (includes nonfederal, patient care physicians) 3 HSC analysis of 2008 county per capita Medicare fee-for-service expenditures, Part A and Part B aged and disabled, weighted by enrollment and demographic and risk factors. See www.cms.gov/MedicareAdvtgSpecRateStats/05_FFS_Data.asp. |
||
Funding Acknowledgement
The 2010 Community Tracking Study and resulting Community Reports were funded jointly by the Robert Wood Johnson Foundation and the National Institute for Health Care Reform. Since 1996, HSC researchers have visited the 12 communities approximately every two to three years to conduct in-depth interviews with leaders of the local health system.