
Impact of Health Care Price Transparency on Price Variation: The New Hampshire Experience
Issue Brief No. 128
November 2009
Ha T. Tu, Johanna Lauer
Price variation for medical procedures performed in both hospital outpatient
departments and freestanding facilities has not decreased in New Hampshire since
the state launched the HealthCost price transparency program in early 2007,
according to new research jointly conducted by the New Hampshire Insurance Department
and the Center for Studying Health System Change (HSC). New Hampshire stakeholders
cited weak provider competition as the key reason for lack of impact. The state’s
hospital market is geographically segmented in rural areas and has few competitors
even in urban areas. In addition, few consumers have strong incentives to shop
based on price: Only 5 percent of the state’s privately insured residents
were enrolled in high-deductible plans in 2007. However, some observers suggested
that HealthCost—along with other state price transparency initiatives—has
helped to focus employer and policy maker attention on provider price differences
and has caused some hospitals to moderate their demands for rate increases.
- Price Variation Remains Despite Price Transparency
- No Impact on Price Variation across Providers
- Weak Provider Competition
- Few Incentives for Consumers to Compare Prices
- Limited Impact on Hospital-Insurer Negotiations
- Some Promising Signs for Price Transparency
- Policy Implications
- Notes
- Data Source and Funding Acknowledgement
- Supplementary Table
Price Variation Remains Despite Price Transparency
![]() n recent years, many states have undertaken initiatives
to report health care prices to the public to support cost-conscious shopping
by consumers and, ultimately, spur competition and increase efficiency among
providers. New Hampshire was among the first states to introduce a price transparency
program aimed at helping consumers comparison shop for common health services.
In early 2007, New Hampshire launched the HealthCost Web site to report the
bundled cost, including both physician and facility payments, of about 30 common
health care services. Most of the services are performed in hospital outpatient
departments and freestanding facilities (see box below for
a general description of the HealthCost program). Unlike most other state price
transparency initiatives that only report hospital charges, HealthCost reports
more useful provider-specific, insurer-specific median cost estimates for each
service, based on claims data collected from health insurers.1
n recent years, many states have undertaken initiatives
to report health care prices to the public to support cost-conscious shopping
by consumers and, ultimately, spur competition and increase efficiency among
providers. New Hampshire was among the first states to introduce a price transparency
program aimed at helping consumers comparison shop for common health services.
In early 2007, New Hampshire launched the HealthCost Web site to report the
bundled cost, including both physician and facility payments, of about 30 common
health care services. Most of the services are performed in hospital outpatient
departments and freestanding facilities (see box below for
a general description of the HealthCost program). Unlike most other state price
transparency initiatives that only report hospital charges, HealthCost reports
more useful provider-specific, insurer-specific median cost estimates for each
service, based on claims data collected from health insurers.1
Despite the attention that price transparency has received from policy makers, there has been a dearth of research to date examining what effects, if any, public reporting of prices has had on overall price levels and price variation across health care providers. When prices are made transparent—publicly reported and known to all parties—price differences across providers can be expected to decrease, as low-cost providers are motivated to raise their prices and high-cost providers come under pressure to lower their prices. However, whether transparency raises or lowers overall price levels is uncertain, and depends largely on the concentration and market power of health care providers relative to insurers.2
Ideally, it would be useful to understand the extent to which a particular price transparency initiative has affected overall price levels. However, it is difficult, if not impossible, to compare pre-transparency and post-transparency prices and ascribe any observed difference to a particular price transparency program, because there are a multitude of influences external to the price transparency program that might have impacted price levels. These factors include competitive conditions, technological innovation and other policy initiatives and developments. No multivariate model can adequately capture and estimate the magnitude of these other factors.
As a result of the issues inherent in correctly attributing price changes to any particular program, this report focuses primarily on the effect that price transparency has had on price variation, rather than price levels. The analysis uses a combination of quantitative and qualitative methods (see Data Source).
Back to Top
New Hampshire HealthCost ProgramIn 2003, as part of an initiative to improve the transparency of health care prices, the New Hampshire Legislature mandated the collection of claims data from all commercial insurers in the state. These claims data were used by the state to develop the New Hampshire Comprehensive Health Information System (NHCHIS) dataset, which in turn was used to calculate cost estimates for 31 common services performed at hospitals or other medical facilities. HealthCost, the Web site that reports these cost estimates to the public, was launched in February 2007. All but one of the services (childbirth) reported on HealthCost are outpatient services; most are imaging or surgical procedures. For each service, HealthCost reports the estimated median total amount paid by both insurer and patient (i.e., “allowed amount”) for a service, including both facility and physician payments. The median amount is used rather than the mean (average) to mitigate the impact of outliers. For each service, consumers can generate provider-specific cost estimates, broken down by the consumer’s geographic location, insurance status, and insurance carrier and product. More information on the HealthCost program and its methodology for calculating costs is available at www.nhhealthcost.org/method.aspx. In addition to the HealthCost Web site, there is a public-use-file version of the full NHCHIS dataset, which includes data on a comprehensive set of health services but is blinded as to insurer. This public use file is not targeted toward the consumer, as its use requires advanced knowledge of data analysis. |
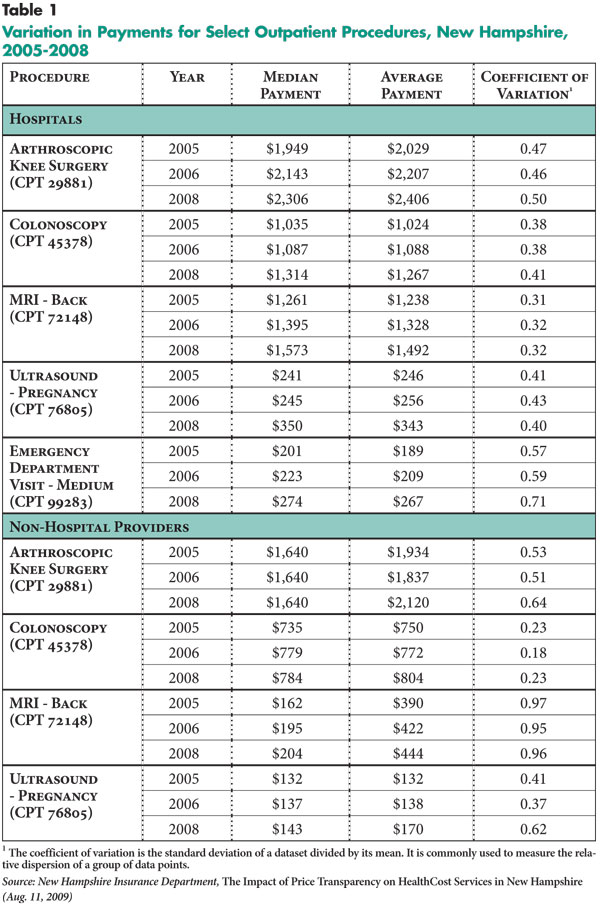
No Impact on Price Variation across Providers
![]() he main finding of the quantitative analysis conducted
by the New Hampshire Insurance Department (NHID) is that in the post-transparency
period, price variation did not decrease for the services where prices were
reported on the HealthCost Web site. The coefficient of variation, the indicator
used to measure the magnitude of price variation, remained about the same for
most services from the pre-transparency periods (2005, 2006) to the post-transparency
period (2008).3 An NHID report presents findings for each
of the 30 services reported by HealthCost.4 For the sake
of brevity, this Issue Brief presents results for a subset of five HealthCost
services: arthroscopic knee surgery; colonoscopy; magnetic resonance imaging
(MRI) test for the back; ultrasound—pregnancy; and emergency room visit—medium
(see Table 1). Results for these five services—which
are representative of results for the full set of 30 services—strongly
indicate that in the first full year after the public launch of HealthCost,
the initiative did not yet impact price variation.
he main finding of the quantitative analysis conducted
by the New Hampshire Insurance Department (NHID) is that in the post-transparency
period, price variation did not decrease for the services where prices were
reported on the HealthCost Web site. The coefficient of variation, the indicator
used to measure the magnitude of price variation, remained about the same for
most services from the pre-transparency periods (2005, 2006) to the post-transparency
period (2008).3 An NHID report presents findings for each
of the 30 services reported by HealthCost.4 For the sake
of brevity, this Issue Brief presents results for a subset of five HealthCost
services: arthroscopic knee surgery; colonoscopy; magnetic resonance imaging
(MRI) test for the back; ultrasound—pregnancy; and emergency room visit—medium
(see Table 1). Results for these five services—which
are representative of results for the full set of 30 services—strongly
indicate that in the first full year after the public launch of HealthCost,
the initiative did not yet impact price variation.
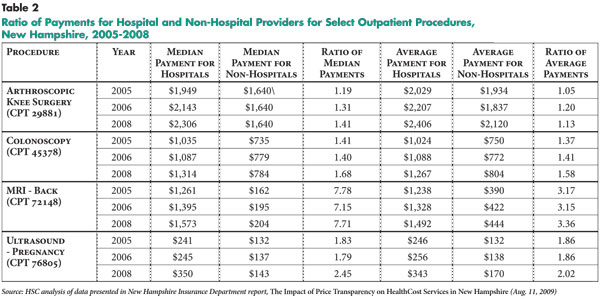
NHID conducted the price-variation analysis separately for hospitals and non-hospital providers (e.g., ambulatory surgery centers (ASCs), imaging centers) because the cost structures of the two provider types were considered too different to be combined into a single analysis. From the average prices shown in Table 1, it can be seen that prices for the same procedure are consistently higher—sometimes strikingly higher—in hospitals compared to other facilities.
One of the desired effects of price transparency is to prompt higher-priced providers to lower their prices to remain competitive and prevent erosion of market share. To assess whether this effect has taken place, it is useful not only to analyze hospital price variation over time separately from non-hospital price variation over time (as shown in Table 1), but also to examine whether the gap between hospital and non-hospital prices has narrowed in the wake of public price reporting. A comparison of hospital/non-hospital price ratios pre-transparency and post-transparency shows that HealthCost also has had no impact on the price gap between hospitals and other facilities (see Table 2). This finding holds true whether the analysis is conducted on mean or median prices. Although this analysis presents ratios of hospital/non-hospital prices for only four services, the pattern of unchanged variation held true across the entire range of HealthCost services.
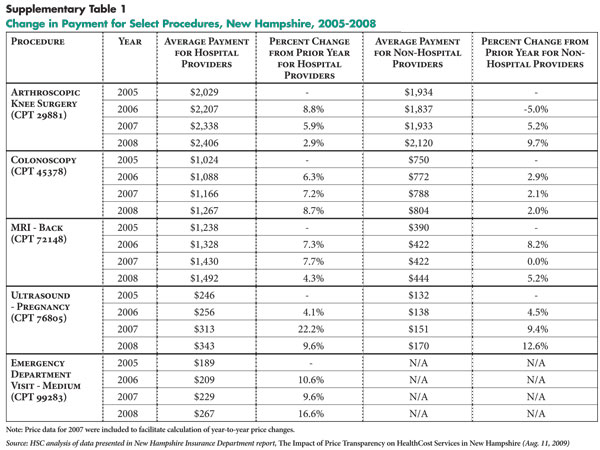
As noted earlier, changes in overall price levels cannot be ascribed to any particular price transparency initiative, because many external factors can affect price levels. However, given considerable interest from stakeholders and observers about the impact of price transparency on price levels, an examination of year-to-year price changes before and after introduction of the HealthCost program is useful (see Supplementary Table 1). No consistent pattern emerges of either an increase or decrease in price trends in the post-transparency period; this is true not just for the sample set of five services presented here, but also the full set of 30 services analyzed by NHID.
Back to Top
Weak Provider Competition
![]() he quantitative findings showing no change in price variation were consistent with the views of most representatives of health plans, hospitals and other provider organizations interviewed about their perspectives of the HealthCost program. The majority of respondents said that they had not expected or observed any significant impact of HealthCost on price levels and price variation, primarily because of weak provider competition throughout the state.
he quantitative findings showing no change in price variation were consistent with the views of most representatives of health plans, hospitals and other provider organizations interviewed about their perspectives of the HealthCost program. The majority of respondents said that they had not expected or observed any significant impact of HealthCost on price levels and price variation, primarily because of weak provider competition throughout the state.
One observer described New Hampshire as having “three more or less distinct [health care] markets:” the rural areas, the urban corridor and the Seacoast area. The rural areas are characterized by geographic segmentation, with each hospital controlling a distinct geographic area, making it “nearly impossible,” according to one health plan executive, for plans to threaten exclusion of a hospital from its provider network. In addition, most of the rural hospitals are designated as critical access hospitals, meaning that they receive cost-based reimbursement from Medicare; most insurers then negotiate their commercial rates as a percentage of the cost-based Medicare rates. As a result of geographic segmentation and cost-based reimbursement, the state’s rural hospitals “don’t compete. in a meaningful sense,” according to one policy expert.
The urban corridor in the southern part of the state has more provider competition than the rural areas, but respondents observed that even in the cities, there are limits to the extent and vigor of hospital competition. For example, the cities of Manchester and Nashua each have two hospitals located near each other, but one hospital has a religious affiliation and the other does not; many people have longstanding, deeply held preferences for one or the other. As a result, insurance products that exclude either of the hospitals in each city will be unattractive to a sizable segment of the population. Especially in situations where employers do not offer a choice of health plans to their employees, the offered plan needs to have broad appeal to consumers.
Provider capacity constraints further limit insurers’ options for restricting their provider networks. A hospital executive observed that if Anthem Blue Cross and Blue Shield—the leading insurer with approximately half of the commercial market—were to exclude one of the urban hospitals from its network, the other hospital in that city would lack the capacity to handle all of the Anthem enrollees. Because both providers and insurers are aware of these constraints, competition among hospitals is limited and hospital leverage over insurers is strong, according to several respondents.
The Seacoast area in the eastern part of the state has four hospitals within a 30-mile radius—a situation that should facilitate a reasonable degree of hospital competition. Yet, Seacoast hospitals are among those that have historically negotiated the highest payment rates in the state, according to several observers. Respondents attributed this high-cost pattern to a complex interaction of factors, including the more aggressive negotiating style of Seacoast hospitals; the for-profit status of one of the hospitals; and the affluent, loyal patient base in some parts of the Seacoast. Indeed, the hospital generally acknowledged by respondents to be the most expensive in the state—Exeter Hospital—is located in the greater Seacoast area and was viewed by some respondents as insulated from pressure to lower rates by its prestigious reputation in an affluent and loyal community. One health plan reported that it was “unable to work up any. purchaser interest” in a provider network that excluded Exeter.
Few Incentives for Consumers to Compare Prices
![]() Bsides the lack of hospital competition, nearly all respondents
noted another key reason for HealthCost not making an impact in price variation:
Most consumers have little or no financial incentive to comparison shop for
health services. While high-deductible health plans have grown in New Hampshire
in recent years, they still constitute a very small share of the commercial
insurance base. The proportion of privately insured people enrolled in high-deductible
plans grew from 1.5 percent in 2006 to 5.3 percent in 2007.5
Many respondents observed that without substantial “skin in the game,” most
consumers have little or no incentive to shop for the lowest provider prices.
Besides choosing the provider in the most convenient location, patients typically
follow their physicians’ guidance about where to go for medical procedures,
according to many health plan and hospital executives.
Bsides the lack of hospital competition, nearly all respondents
noted another key reason for HealthCost not making an impact in price variation:
Most consumers have little or no financial incentive to comparison shop for
health services. While high-deductible health plans have grown in New Hampshire
in recent years, they still constitute a very small share of the commercial
insurance base. The proportion of privately insured people enrolled in high-deductible
plans grew from 1.5 percent in 2006 to 5.3 percent in 2007.5
Many respondents observed that without substantial “skin in the game,” most
consumers have little or no incentive to shop for the lowest provider prices.
Besides choosing the provider in the most convenient location, patients typically
follow their physicians’ guidance about where to go for medical procedures,
according to many health plan and hospital executives.
However, in the wake of HealthCost’s launch, representatives from ASCs and imaging centers reported a slight but noticeable increase in new patients who mentioned selecting the facility for its low costs. In some cases, these patients identified the facility as low cost after consulting HealthCost directly (sometimes after hearing about the program through word of mouth or a media report); in other cases, patients were steered to the facility by a health plan, which cited the facility’s lower costs.
Some observers suggested that consumer incentives to shop may increase significantly in the near future. Most private employers in New Hampshire are small firms that are very sensitive to price in insurance-purchasing decisions, making it likely that high-deductible plans will continue to gain traction. As more consumers face greater out-of-pocket cost exposure, their incentive to consult comparison-shopping resources, such as HealthCost, should increase accordingly.
New Hampshire’s large public employers historically have provided comprehensive health benefits with low patient cost sharing, but in the face of escalating health costs and serious budget constraints, they have banded together to form the New Hampshire Purchasers Group on Health. This group has begun to use provider cost data to explore tiered-provider benefit designs to give consumers financial incentives to use lower-cost providers.
Back to Top
Limited Impact on Hospital-Insurer Negotiations
![]() espite their relatively weak negotiating position, most
of New Hampshire’s major insurers reported attempting to use HealthCost data
to extract rate concessions from hospitals—for the most part unsuccessfully.
When insurers have tried to use HealthCost data as evidence of high costs, hospitals
have typically responded that the data are not recent enough to reflect current
rates; the data are not accurate enough to capture actual rates; and/or the
data present an incomplete, misleading picture because HealthCost covers only
a small subset of hospital services.6 Insurers reported
that some hospitals also have tried using HealthCost data selectively to “negotiate
up” their rates.
espite their relatively weak negotiating position, most
of New Hampshire’s major insurers reported attempting to use HealthCost data
to extract rate concessions from hospitals—for the most part unsuccessfully.
When insurers have tried to use HealthCost data as evidence of high costs, hospitals
have typically responded that the data are not recent enough to reflect current
rates; the data are not accurate enough to capture actual rates; and/or the
data present an incomplete, misleading picture because HealthCost covers only
a small subset of hospital services.6 Insurers reported
that some hospitals also have tried using HealthCost data selectively to “negotiate
up” their rates.
Because most hospitals reportedly are above the median cost on some services and below the median on others,7 neither insurers nor hospitals have been able to use HealthCost data effectively in rate negotiations, according to several respondents. According to one hospital executive, “If [insurers] try to show me that I’m an outlier for this MRI, I’ll show them these other [services] where I’m well below the median. It cuts both ways. [and] two can play the game. In the end, we both agreed. [to] set aside the data and negotiate like we always have.”
Hospitals have uniformly resisted efforts by insurers and policy makers to compare hospital prices with the much lower prices offered by ASCs or imaging centers. Hospital executives contended that the comparison is one of “apples and oranges” because they cannot “cherry-pick” profitable patients or services as other facilities can: “We have to take all comers. [including] Medicaid and uninsured,” and “we have to cross-subsidize. across payers [and] across services,” according to hospital executives. Hospitals argued that the need to use commercial payment rates to subsidize inadequate Medicaid reimbursement has become even more acute since late 2008, when the state—facing severe budget shortfalls—reportedly cut Medicaid rates to Prospective Payment System hospitals by 33 percent for outpatient services and 10 percent for inpatient services.8
Back to Top
Some Promising Signs for Price Transparency
![]() hile the view that HealthCost has had no impact on prices was shared by most respondents, it was by no means universal. Some suggested that—along with other New Hampshire transparency initiatives—HealthCost has helped to dampen provider demands for large rate increases. According to one policy analyst, “It’s hard to quantify, but some of these hospitals might have asked for double-digit increases, if not for the comparative cost information being out there in the public domain. Most don’t want to be seen as price-gougers.” A health plan executive agreed, saying: “Many [hospital] boards are sensitive to their reputation in the community. and don’t want their hospitals to be perceived as the most costly ones.” However, if higher-cost hospitals have indeed moderated their rate increase demands, this change should have manifested itself as a reduction in price variation in NHID’s quantitative analysis. As described earlier, NHID’s analysis showed no change in price variation.
hile the view that HealthCost has had no impact on prices was shared by most respondents, it was by no means universal. Some suggested that—along with other New Hampshire transparency initiatives—HealthCost has helped to dampen provider demands for large rate increases. According to one policy analyst, “It’s hard to quantify, but some of these hospitals might have asked for double-digit increases, if not for the comparative cost information being out there in the public domain. Most don’t want to be seen as price-gougers.” A health plan executive agreed, saying: “Many [hospital] boards are sensitive to their reputation in the community. and don’t want their hospitals to be perceived as the most costly ones.” However, if higher-cost hospitals have indeed moderated their rate increase demands, this change should have manifested itself as a reduction in price variation in NHID’s quantitative analysis. As described earlier, NHID’s analysis showed no change in price variation.
Since HealthCost was launched, other public and private price transparency initiatives have been introduced in New Hampshire. One private initiative was the recent roll-out of Anthem’s Care Comparison online tool, which allows enrollees to compare hospitals and other facilities on quality and cost indicators for about 40 inpatient and outpatient services. At least one other insurer is taking a different approach, opting to steer enrollees toward the HealthCost Web site rather than developing its own price transparency tools for enrollees.
Among public price transparency initiatives, some respondents pointed to the New Hampshire Hospital Scorecard, sponsored by the New Hampshire Purchasers Group on Health, as showing promise, along with HealthCost, in focusing attention on hospital cost variation. The scorecard publishes Centers for Medicare and Medicaid Services quality measures alongside a cost index for each hospital. The cost index is presented as a range from one to four dollar signs and was calculated by NHID from New Hampshire Comprehensive Health Care Information System (NHCHIS) data, using a market basket of inpatient and outpatient services developed by NHID.9
In addition to launching the hospital scorecard, the state’s large public employers have begun engaging in direct dialogue with high-cost hospitals about ways of bringing down costs or at least moderating cost increases. These public employers also have been using HealthCost and other comparative cost data to explore tiered-provider-network products, as mentioned earlier. Reportedly, the state university system has been the first employer to add such a product to its benefit offerings.
Some policy experts who are optimistic about the potential positive impact of price transparency suggested that transparency efforts need more time to make their effects felt. As one observer noted, the introduction of HealthCost was relatively recent—in early 2007—and many hospital-insurer contracts in New Hampshire span two or three years, so a considerable lag is to be expected in any impact that this or any other price transparency program may have on negotiated rates. In the meantime, according to several policy experts, HealthCost has had a positive impact in focusing attention—particularly among state legislators and employers—on wide price variations across health care providers.
Back to Top
Policy Implications
![]() any New Hampshire stakeholders observed that the impact of price transparency has been blunted by weak provider competition in the state, even in urban areas. Several suggested that an initiative similar to HealthCost might exert a more powerful influence if launched in a health care market with many competing providers and relatively weak provider leverage relative to insurers. Specifically, a few respondents cited Los Angeles—where hospitals are numerous and many do not belong to a dominant health system—as a community where price transparency holds greater promise of bringing down price levels and narrowing price gaps across providers.
any New Hampshire stakeholders observed that the impact of price transparency has been blunted by weak provider competition in the state, even in urban areas. Several suggested that an initiative similar to HealthCost might exert a more powerful influence if launched in a health care market with many competing providers and relatively weak provider leverage relative to insurers. Specifically, a few respondents cited Los Angeles—where hospitals are numerous and many do not belong to a dominant health system—as a community where price transparency holds greater promise of bringing down price levels and narrowing price gaps across providers.
Whatever the extent of provider competition in a particular community, price transparency efforts are unlikely to spur significant price shopping by consumers as long as insurance benefit designs continue to contain little incentive for consumers to choose low-cost providers. In New Hampshire, as well as nationally, financial pressures on both public and private employers may result in more widespread adoption of high-deductible plans, tiered-provider networks and other benefit designs aimed at making consumers more cost-conscious when choosing providers. As more employers aggressively pursue such strategies, more consumers will find incentive to use price transparency tools like HealthCost.
However, there are limits to the extent to which increased patient cost sharing can be expected to lead to more active shopping by consumers. Some New Hampshire stakeholders suggested making HealthCost a more useful shopping tool by adding information about more “big-ticket items” such as heart bypass surgery and hip replacements. However, prices for expensive services often exceed a patient’s deductible even under a high-deductible plan, which would reduce that patient’s incentive to shop for price; in some cases, prices may exceed a patient’s annual out-of-pocket maximum as well, which would eliminate the price-shopping incentive altogether.
In addition, the more complex a procedure, the more difficult it becomes to adequately adjust for differences in patient mix so that prices can be compared accurately and fairly across different providers. And, beyond the most common services, insurer claims volume may be insufficient to provide reliable provider-specific, insurer-specific price estimates. As a result of all these factors, it is likely to prove challenging to expand public price reporting beyond the relatively common and inexpensive outpatient procedures already reported by HealthCost.
Back to Top
Notes
Back to Top
Data Source
A combination of quantitative and qualitative methods was used to study the impact of price transparency on price variation. The quantitative analysis was conducted by the New Hampshire Insurance Department (NHID) using claims data from all New Hampshire commercial insurers through the New Hampshire Comprehensive Health Information System (NHCHIS) dataset. Three years of claims data are presented in this report: two pre-transparency time periods of Jan. 1, 2005 through Sept. 30, 2005 (data were not available prior to January 2005), and Oct. 1, 2005 through Sept. 30, 2006; and one post-transparency time period of Oct. 1, 2007 through Sept. 30, 2008. (For ease of presentation, these time periods are referred to as 2005, 2006 and 2008 in this report.) To calculate prices for each service, NHID calculated the mean (average) rate, rather than the median, as the mean is more sensitive to changes in payment levels. NHID also did not use bundled rates, but instead isolated the technical fees paid to hospitals or non-hospital providers to understand whether negotiated rates for these providers have been affected by public price reporting. A more detailed description of quantitative methods is available in a NHID report (see note 4).
The qualitative analysis was conducted by HSC researchers. A total of 17
interviews were conducted between May and July 2009 with New Hampshire insurers,
hospitals, ambulatory surgery centers, imaging centers and policy experts to
gain their perspectives on the impact of the HealthCost program. Each interview
was conducted by a two-person research team; notes were transcribed and jointly
reviewed for quality and validation purposes. All interview data were coded
and analyzed using Atlas.ti, a qualitative software program.
Funding Acknowledgement:
This research was funded by the California HealthCare Foundation, based in Oakland, Calif.
Back to Top
RESEARCH BRIEFS are published by the Center for Studying Health System
Change.
600 Maryland Avenue, SW, Suite 550
Washington, DC 20024-2512
Tel: (202) 484-5261
Fax: (202) 484-9258
www.hschange.org